
SOC Dashboard
Step-by-step playbook for SOC operations on XHack — adding log sources, writing rules, working alerts, managing incidents, and using suppressions.
SOC Dashboard
This is the operator's manual for the XHack SOC. It walks you through everything you actually do in the day-to-day: getting events flowing in, writing detection rules, working alerts, escalating to incidents, and silencing the noise. Every screen, button, and field below comes from the real UI.
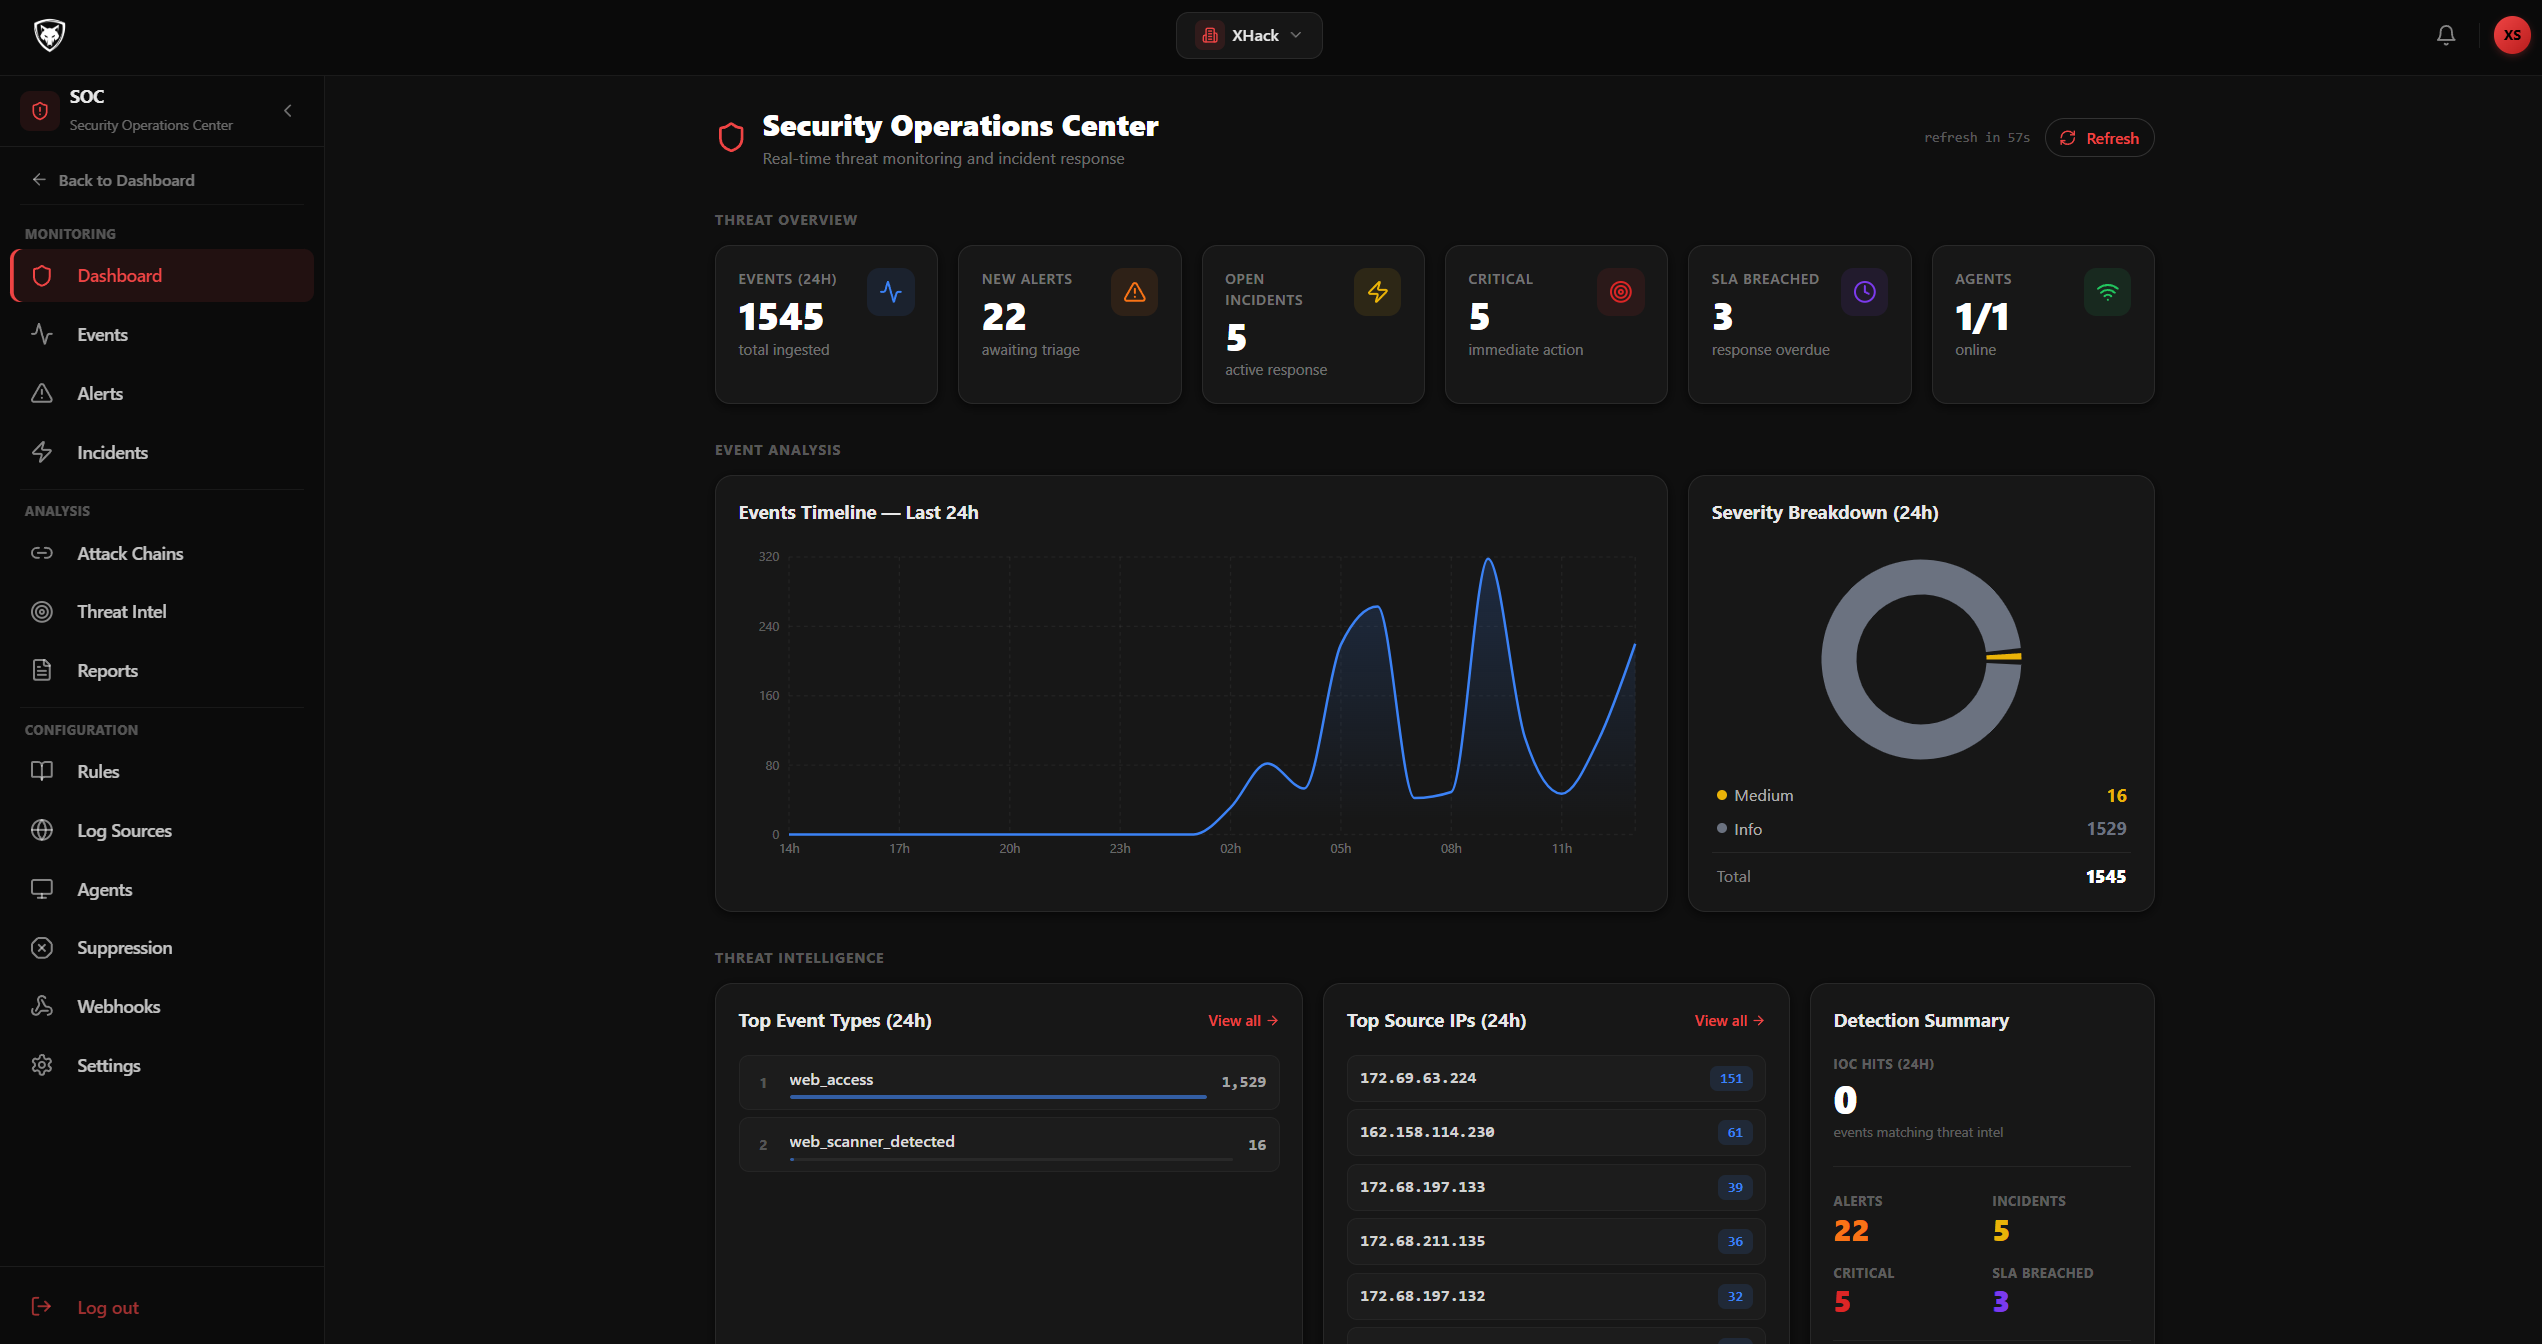
Before you start
You need at least one log source to start receiving events. The SOC pages will be empty until you add one. Skip ahead to Adding a log source if you haven't done that yet.
The SOC sidebar
When you click SOC in the main sidebar, the left panel shows the SOC sub-navigation:
- Events — every raw event ingested
- Alerts — events that matched a detection rule
- Incidents — alerts you've promoted to active investigation
- Attack Chains — multi-stage attack correlation
- Rules — your detection rule library
- Log Sources — where events come from
- Threat Intel — IOC enrichment and threat actor research
- Suppressions — false-positive filters
- Settings — SOC-specific configuration
Adding a log source
Open SOC → Log Sources.
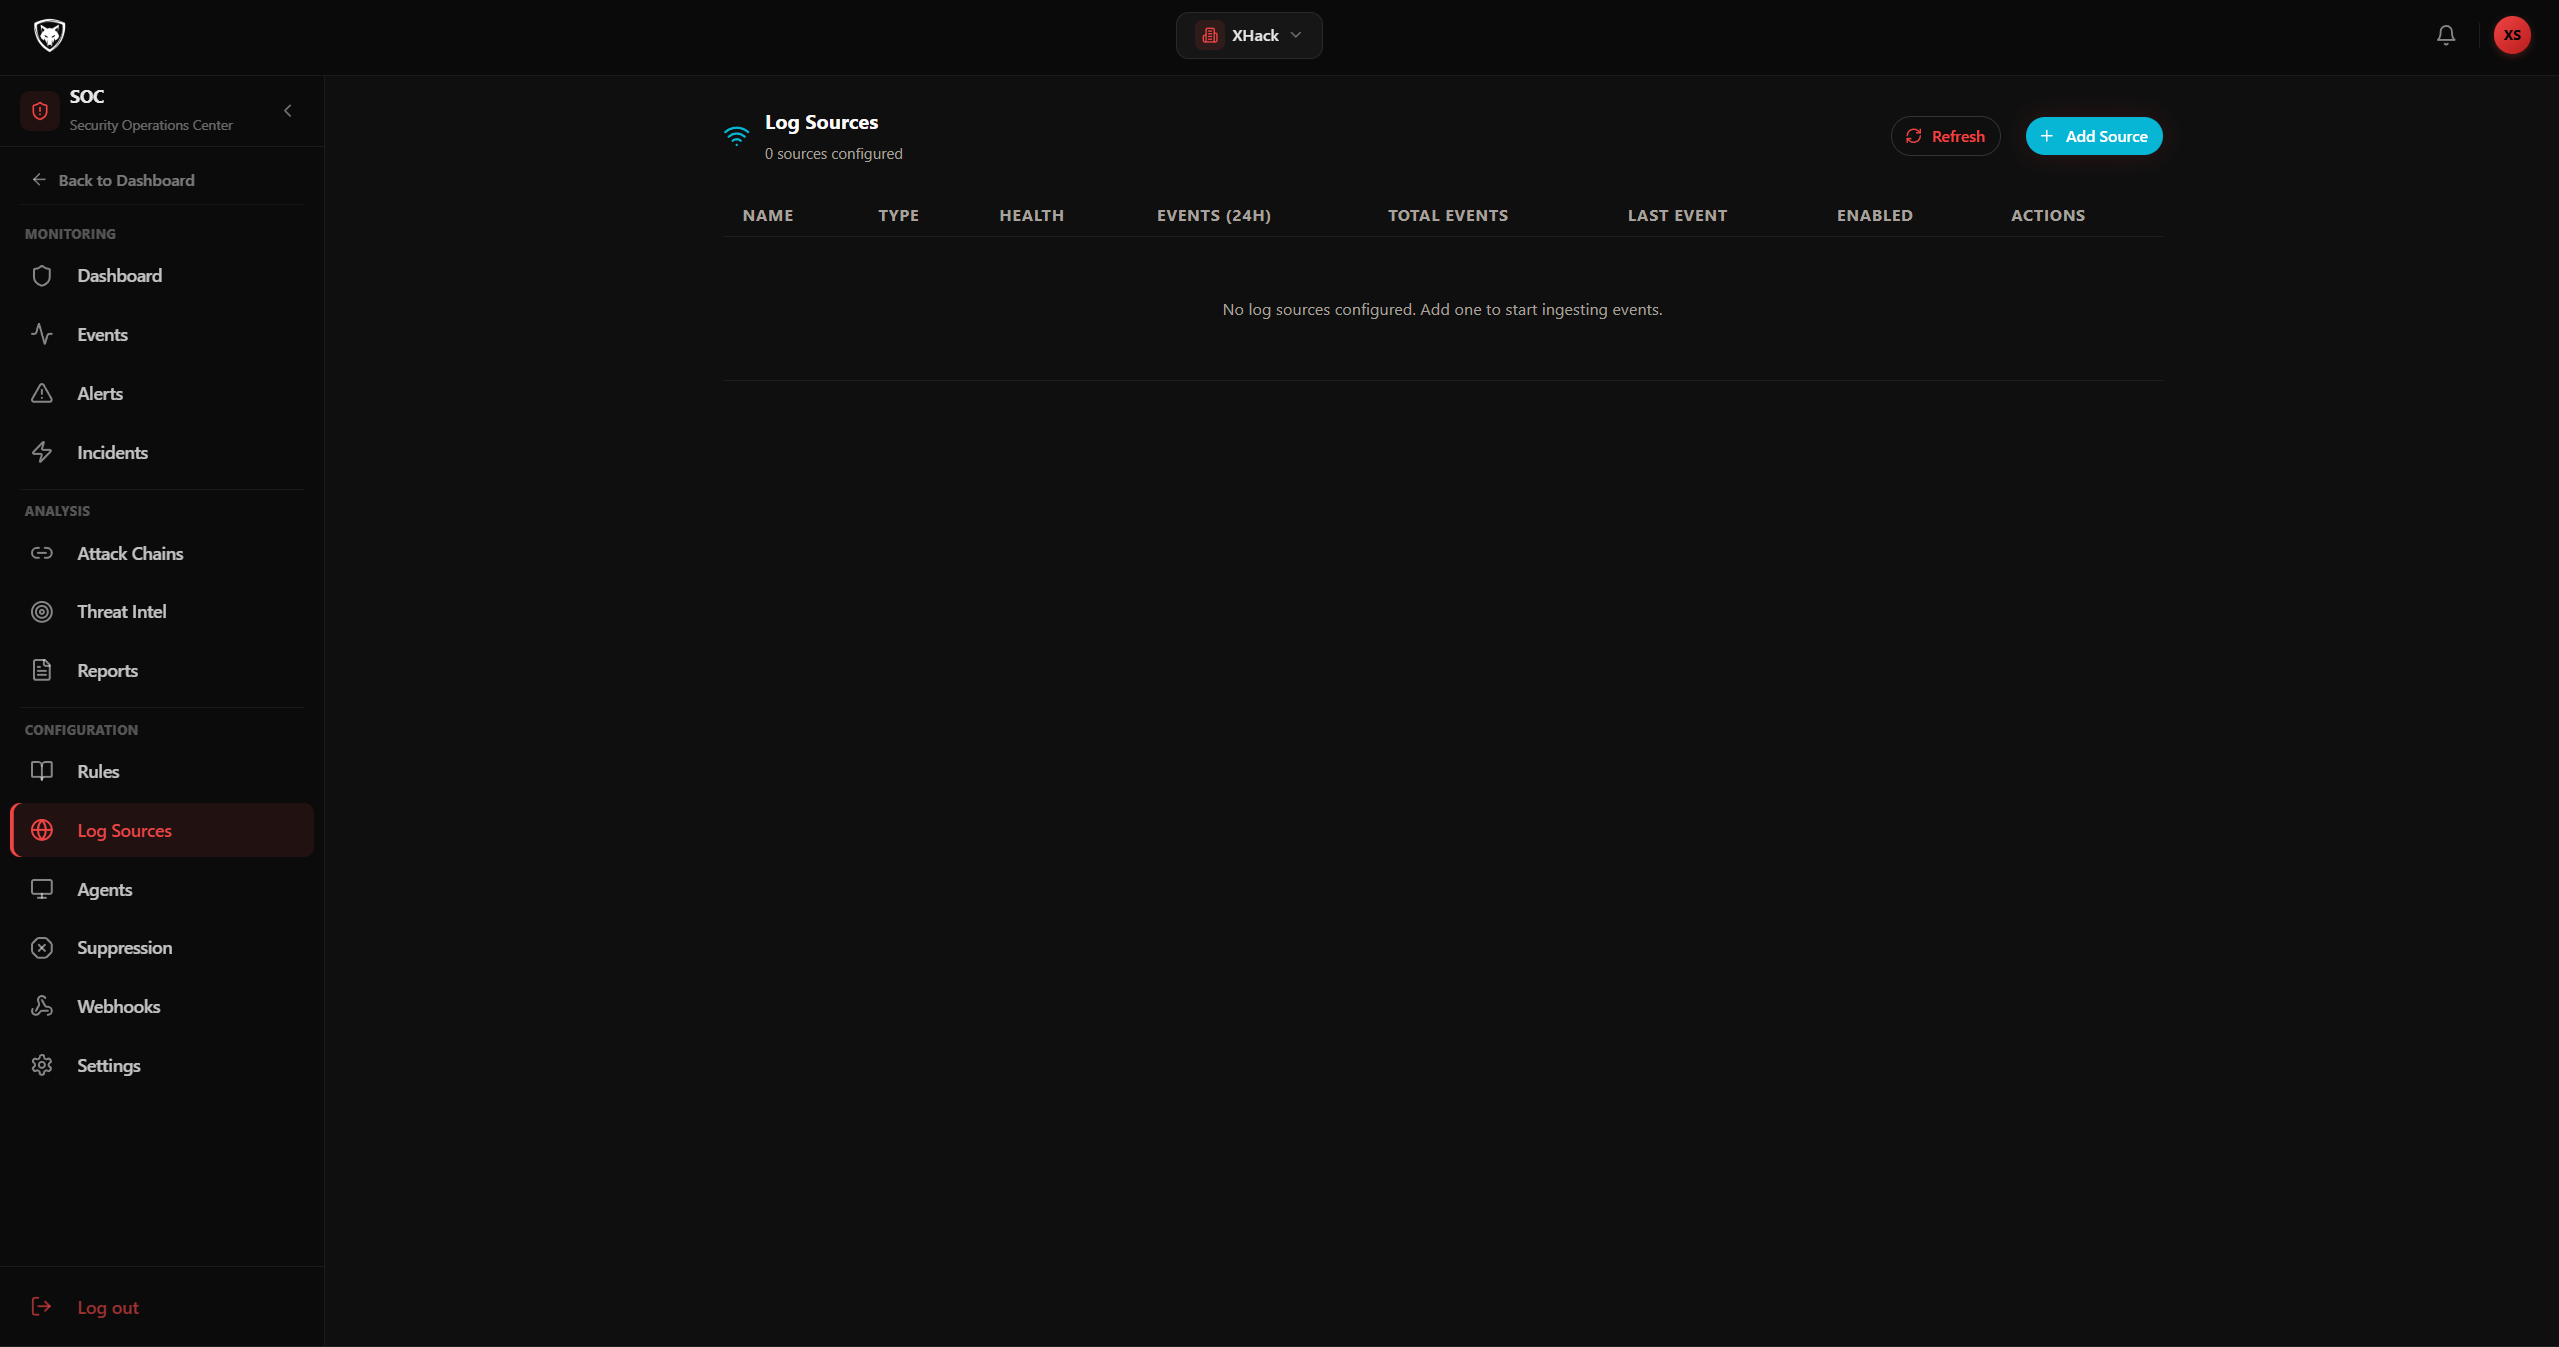
- Click Add Source (top right).
- In the Add Log Source dialog, fill in:
- Name — friendly label like "Edge — Cloudflare prod"
- Description — optional, what feeds it
- Source Type — pick from
wazuh,syslog_udp,syslog_tcp,windows_event,elastic,splunk,webhook,n8n,filebeat,custom_api,cloudflare,file - Enabled — leave on
- The form expands based on the type you pick. For example, Cloudflare asks for:
- API Token — your Cloudflare API token (encrypted at rest)
- Zone ID — the 32-character hex zone ID
- Account ID — optional, also 32-char hex
- Poll Interval (seconds) — how often to fetch (min 60, default 300)
- Enable HTTP Request Logs toggle
- Enable Security Events (WAF/Firewall) toggle
- A Test Connection button — click this before saving
- Click Create.
For webhook and n8n sources, after saving you'll see an Ingest Token and Ingest Endpoint in the source detail view. Use those to configure the sender. Each source type also includes a copy-paste Integration Guide showing the exact ossec.conf, rsyslog.conf, filebeat.yml, or curl snippet you need.
The Health column tells you the source state at a glance: healthy, degraded, offline, or unknown. The Events (24h) column tells you how loud it is.
Writing detection rules
Open SOC → Rules.
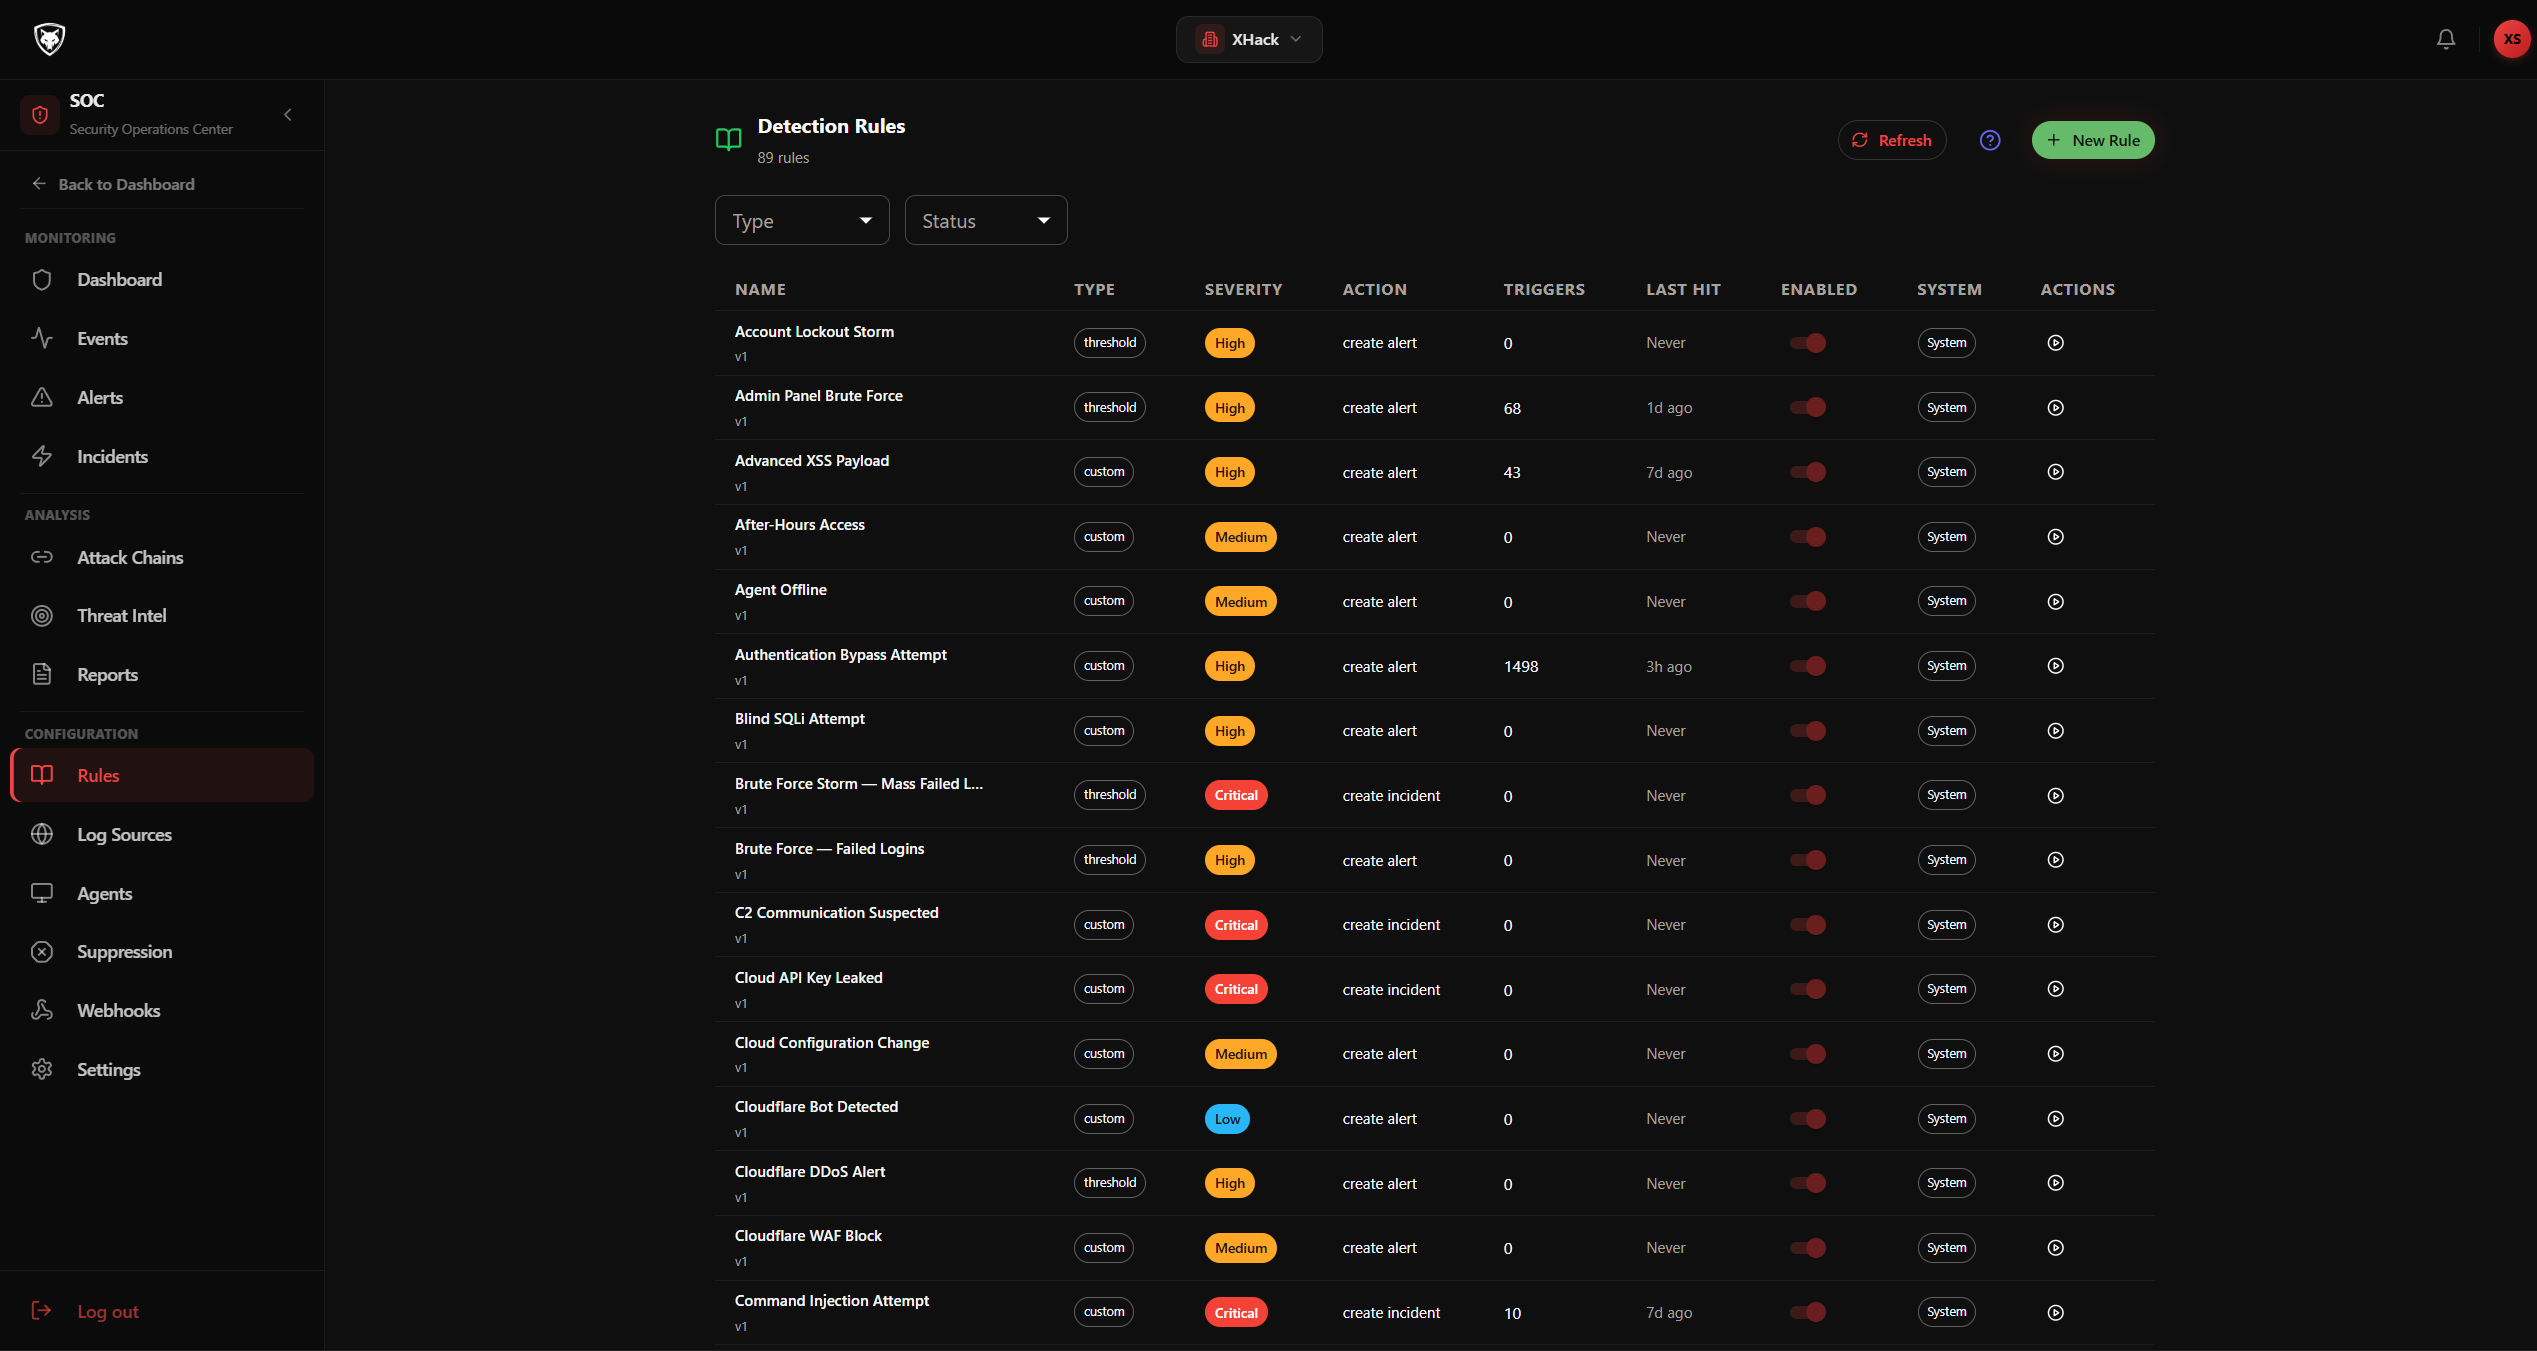
- Click Help (blue icon, top right) to see the rule syntax cheat sheet. The dialog has tabs for Custom Rules, Threshold Rules, Sigma Rules, and the available event types and fields.
- Click Add Rule (green button with sparkles icon).
- In the Create Detection Rule dialog:
- Name — human-readable name
- Description — what the rule catches
- Type —
custom,threshold, orsigma - Severity —
critical,high,medium,low - Action —
alert,escalate,suppress,block,quarantine
- If you picked threshold, also fill in Threshold Count and Window (minutes).
- Write the rule body in Rule Content (large textarea). Or click Generate Rule with AI (magic wand icon) and describe the rule in plain English — the platform will draft it for you. Click Accept to use the draft, Regenerate to try again, or Discard to write it yourself.
- Make sure Enabled is on.
- Click Create.
Testing a rule before going live
Before you let a new rule loose on production traffic, test it:
- Find your rule in the table.
- Click the Test action button on the row.
- In the Test Rule dialog, paste a sample event JSON.
- Click Run (play icon).
- The result shows either a green NO MATCH chip or a red MATCHED chip.
Iterate on the rule body until matches and non-matches are exactly what you expect.
Working alerts
Open SOC → Alerts.
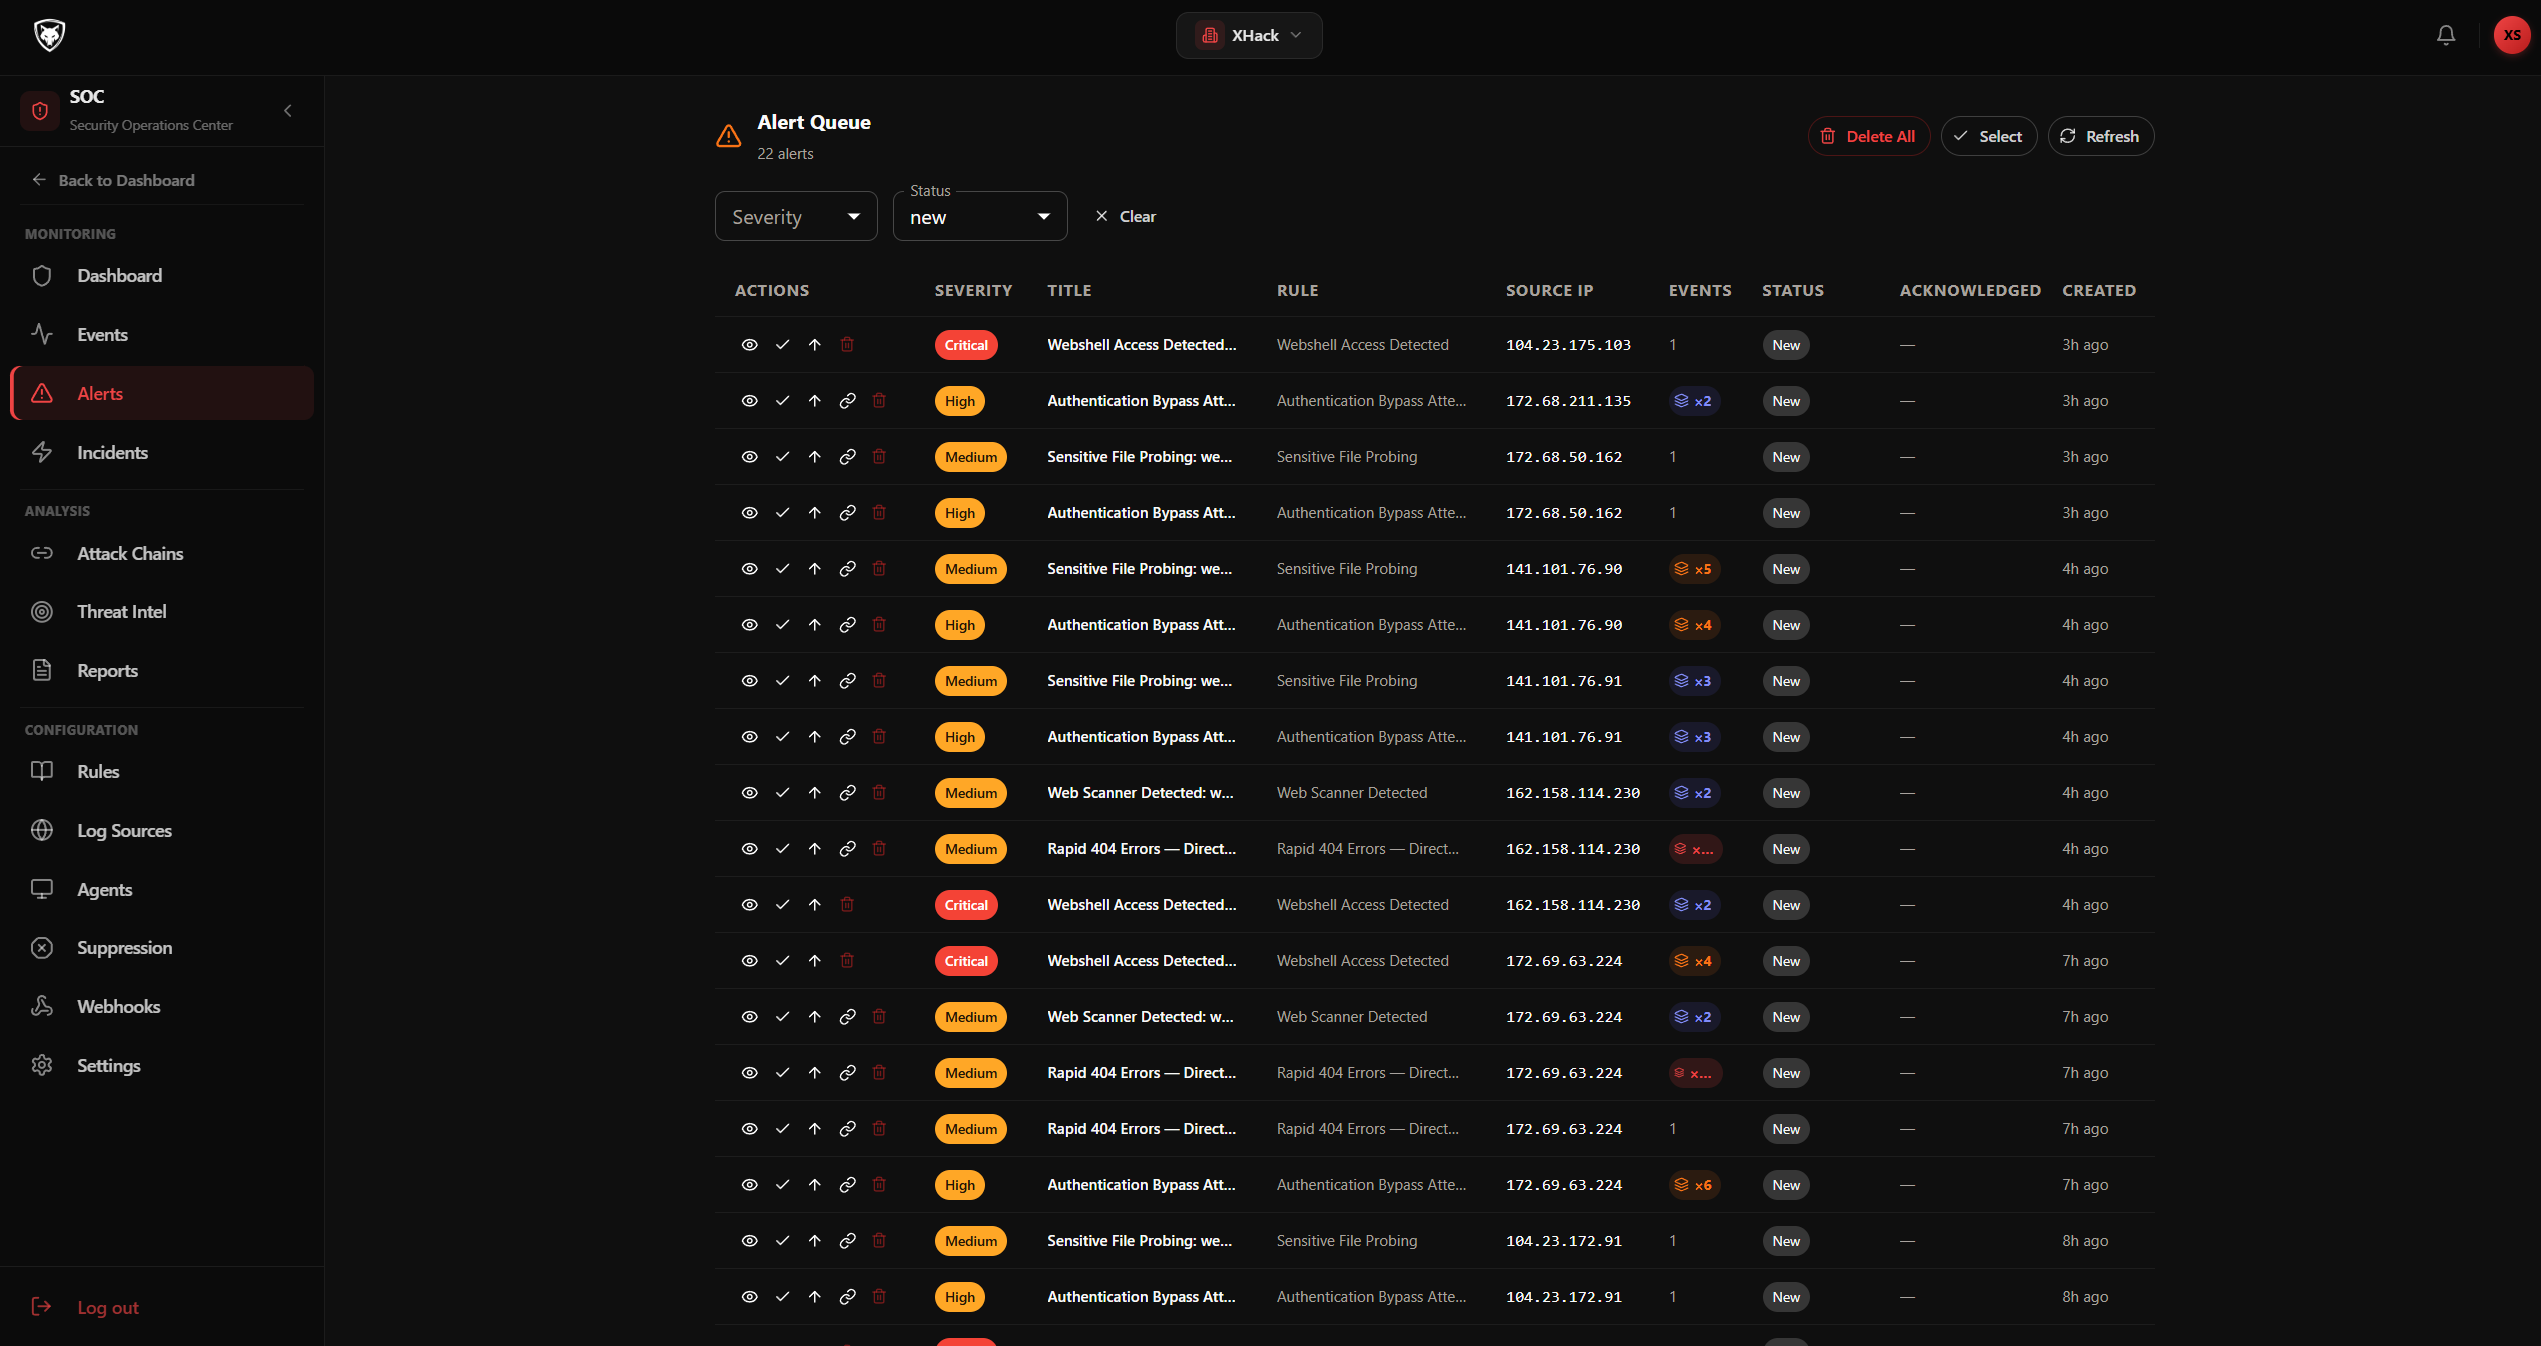
The alert table shows: severity, title, status, rule, event count, and time. Multiple matching events from the same source within the configured grouping window are stacked into a single alert with an event counter — you don't see fifty rows for one attacker hitting fifty endpoints.
Investigating an alert
- Click any alert row to open the Alert Details dialog.
- The dialog shows: severity, status, rule name, contributing event count, full title and description, metadata (Created, Acknowledged, Escalated, Linked Incident).
- Scroll down to the Events section to expand the underlying events with raw JSON.
- If the alert has a
source_ip, click the IP Lookup button to enrich it via Threat Intelligence.
Linking an alert to an incident
From the alert detail dialog:
- Click Link to incident.
- The Link Alert to Incident dialog opens.
- Use the search field at the top to find an existing incident by title, or scroll the list.
- Click the incident you want — the alert is attached.
- Or click Create New Incident at the bottom to spin up a fresh incident from this alert. Fill in Title and Severity, then Create.
Managing incidents
Open SOC → Incidents.
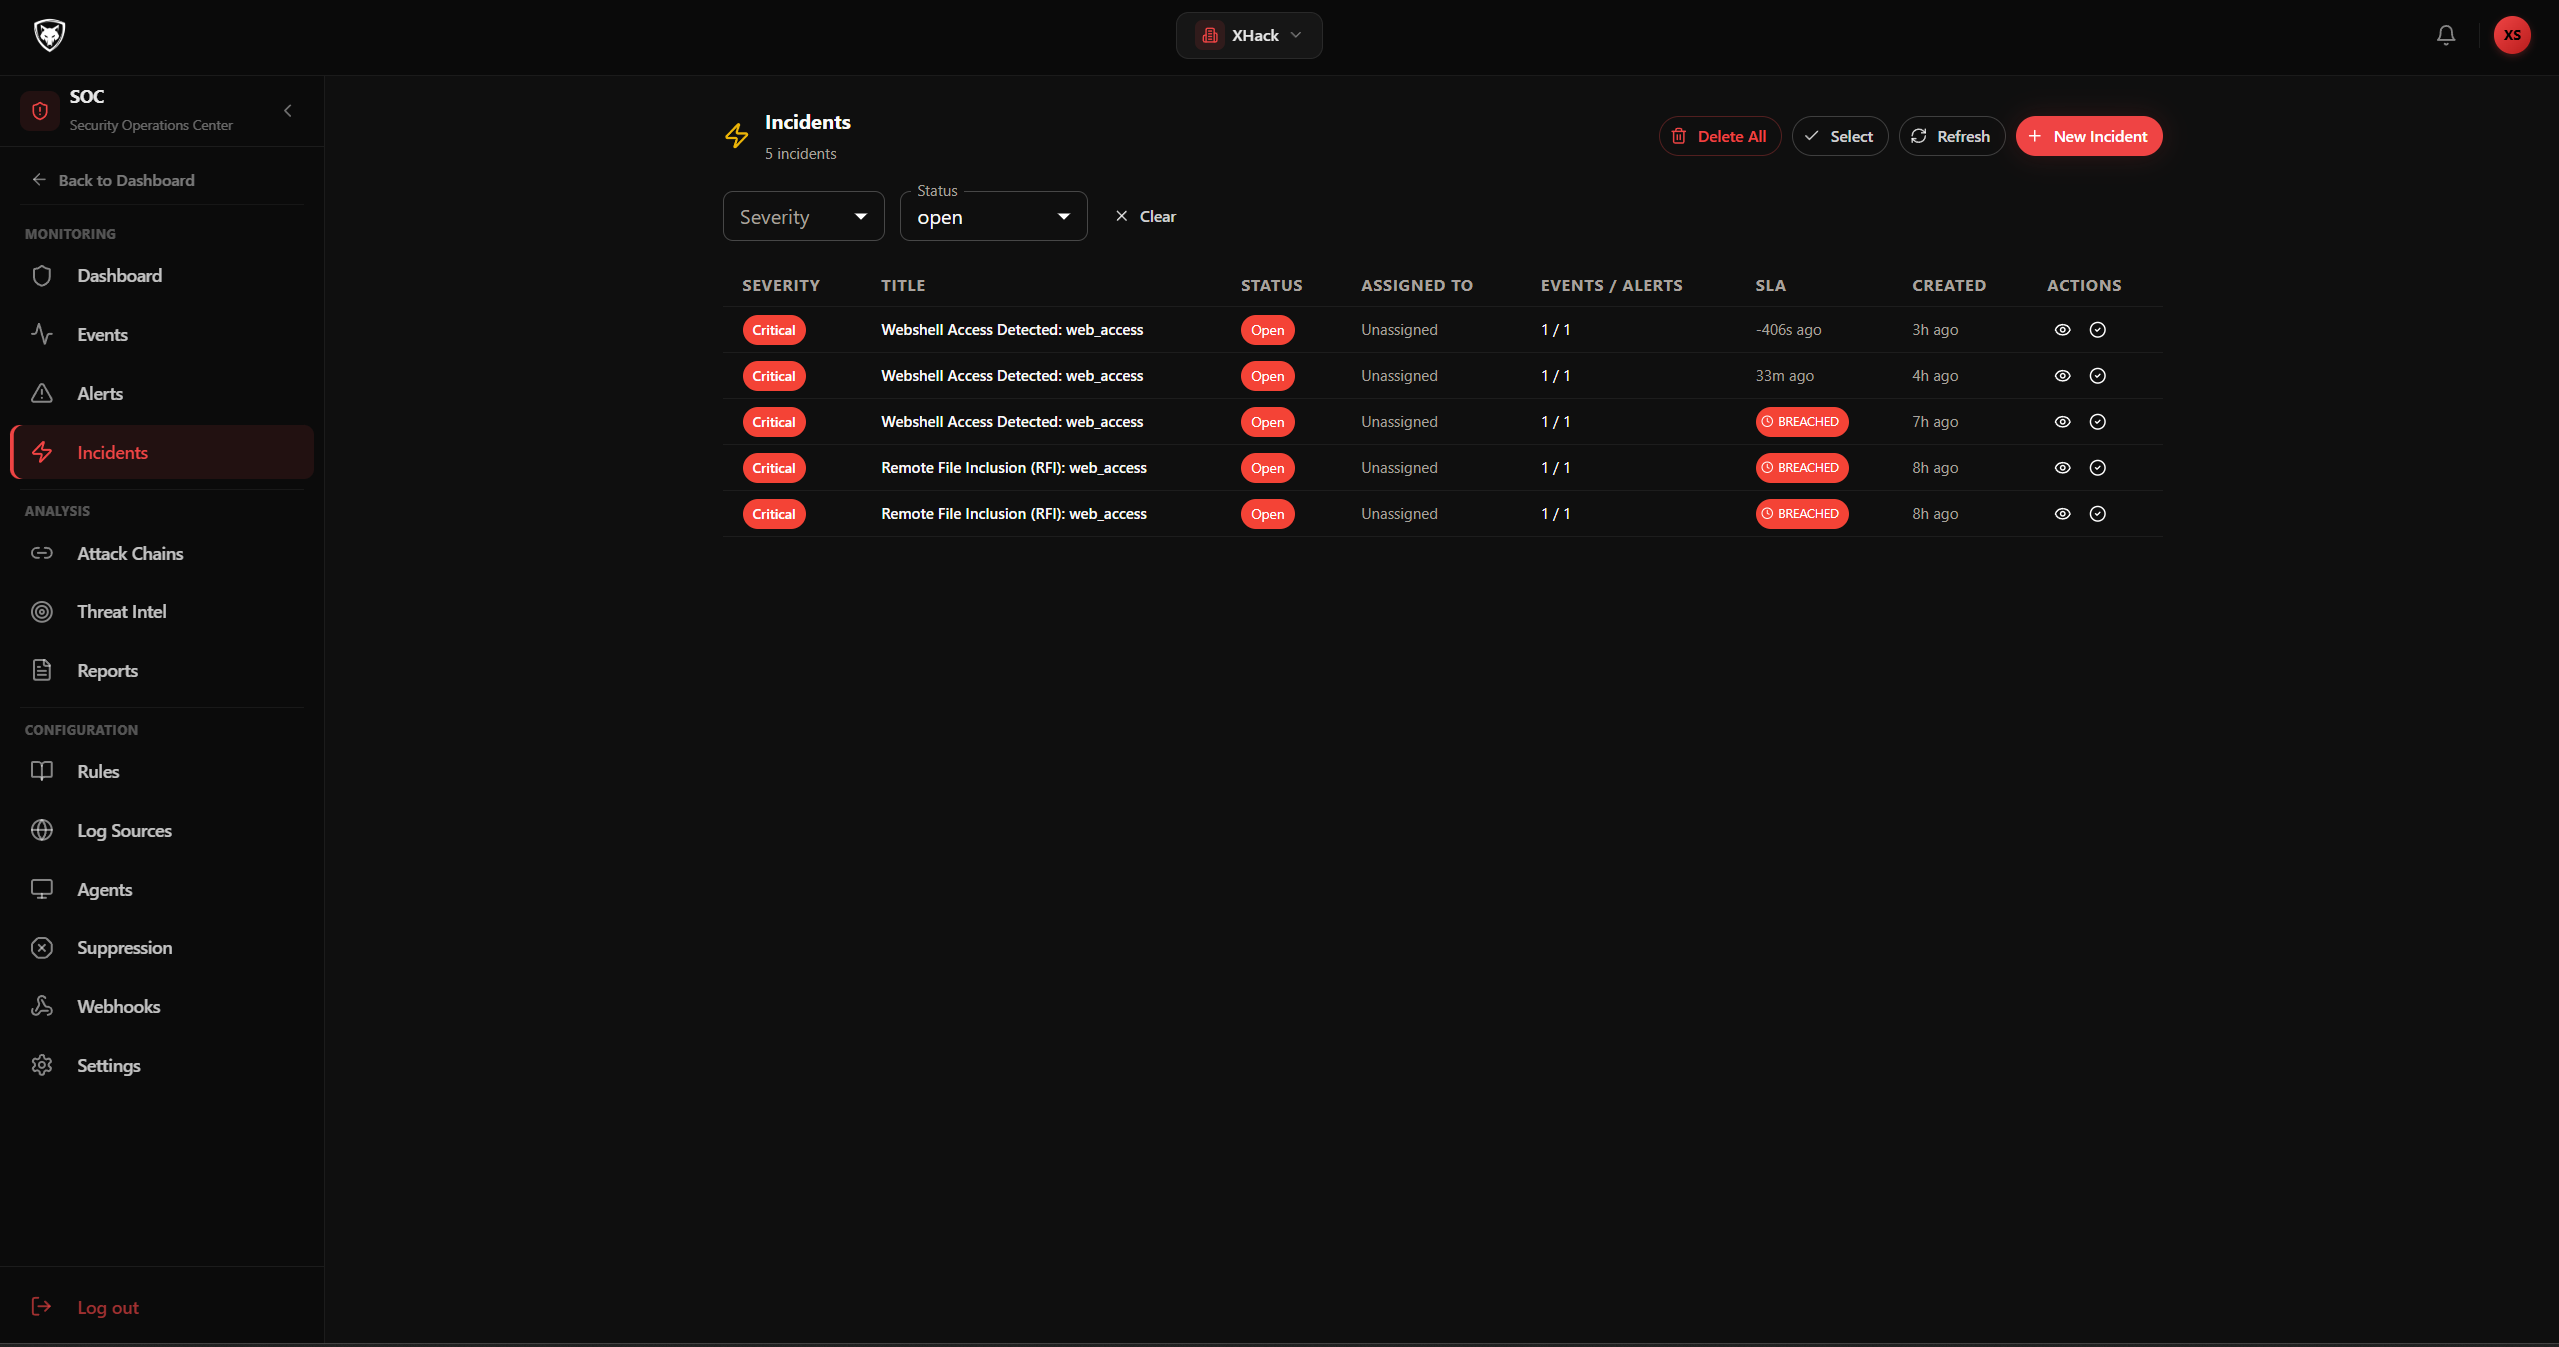
The incidents table shows severity, title, status, assignee, event/alert counts, SLA status, and creation time. Filter at the top by Severity and Status.
Creating an incident manually
- Click New Incident (top right).
- Fill in:
- Title — required
- Description — optional
- Severity —
critical,high,medium,low, orinfo
- Click Create.
Closing an incident
- Find the incident in the table.
- Click Close in the actions column.
- In the Close Incident dialog, add an optional Resolution Note.
- Click Close Incident.
The incident moves to closed status and the SLA timer stops.
Bulk actions
If you have a lot of incidents to triage:
- Click Select in the toolbar to enter selection mode.
- Tick the checkbox on each row you want.
- A bottom bar appears showing "X selected" — click Delete to remove them in bulk.
- Click Done to exit selection mode.
Suppressing false positives
When a rule keeps firing on a known-safe pattern, suppress it instead of disabling the rule entirely.
Open SOC → Suppressions.
- Click Add Suppression Rule.
- Fill in Name and Description.
- Pick Condition Logic:
AND(every condition must match) orOR(any condition). - Click Add Condition to add filter rows. Each row has:
- Field — pick a SOC event field
- Operator —
equals,not_equals,contains,regex,in_list, etc. - Value — the value to match
- Optionally set Expires At so the suppression auto-removes after a date.
- Make sure Enabled is on.
- Click Create.
The suppression takes effect immediately. The Matches column on the suppression list tracks how many alerts it has silenced.
Tips and best practices
- Always test new rules with the Test button before enabling them in production.
- Start small. Enable 5-10 detection rules first, watch the alert volume for a day, then add more.
- Use suppressions, not rule disables. A suppression is surgical and reversible. Disabling a rule blinds you completely.
- Promote alerts that matter, ignore the rest. Not every alert needs an incident. Use the alert counter to spot real campaigns and only escalate those.
- Watch SLA breaches. The Incidents table shows a red BREACHED chip when an incident exceeds its SLA window. Triage those first.
- Use bulk delete during cleanup. When you're tuning rules and generating noise, the Select → Delete flow on Events, Alerts, and Incidents is your friend.
Privacy
All events, alerts, incidents, suppressions, and rules are isolated per tenant. Nothing crosses tenant boundaries. Webhook secrets, log source API tokens, and integration credentials are Fernet-encrypted at rest. Retention is configurable per source and you can hard-delete events at any time.
Related
Try XHack AI Now
Experience the full power of XHack directly in your browser. No installation required.
Launch XHack AI