
Your security operations, without the noise
Centralise your logs and events, detect real threats with an AI analysis engine and a rules engine you control, correlate multi-stage attacks, and run incidents to resolution. All in one dashboard, built into the XHack platform you already use.
app.xhack.io / soc
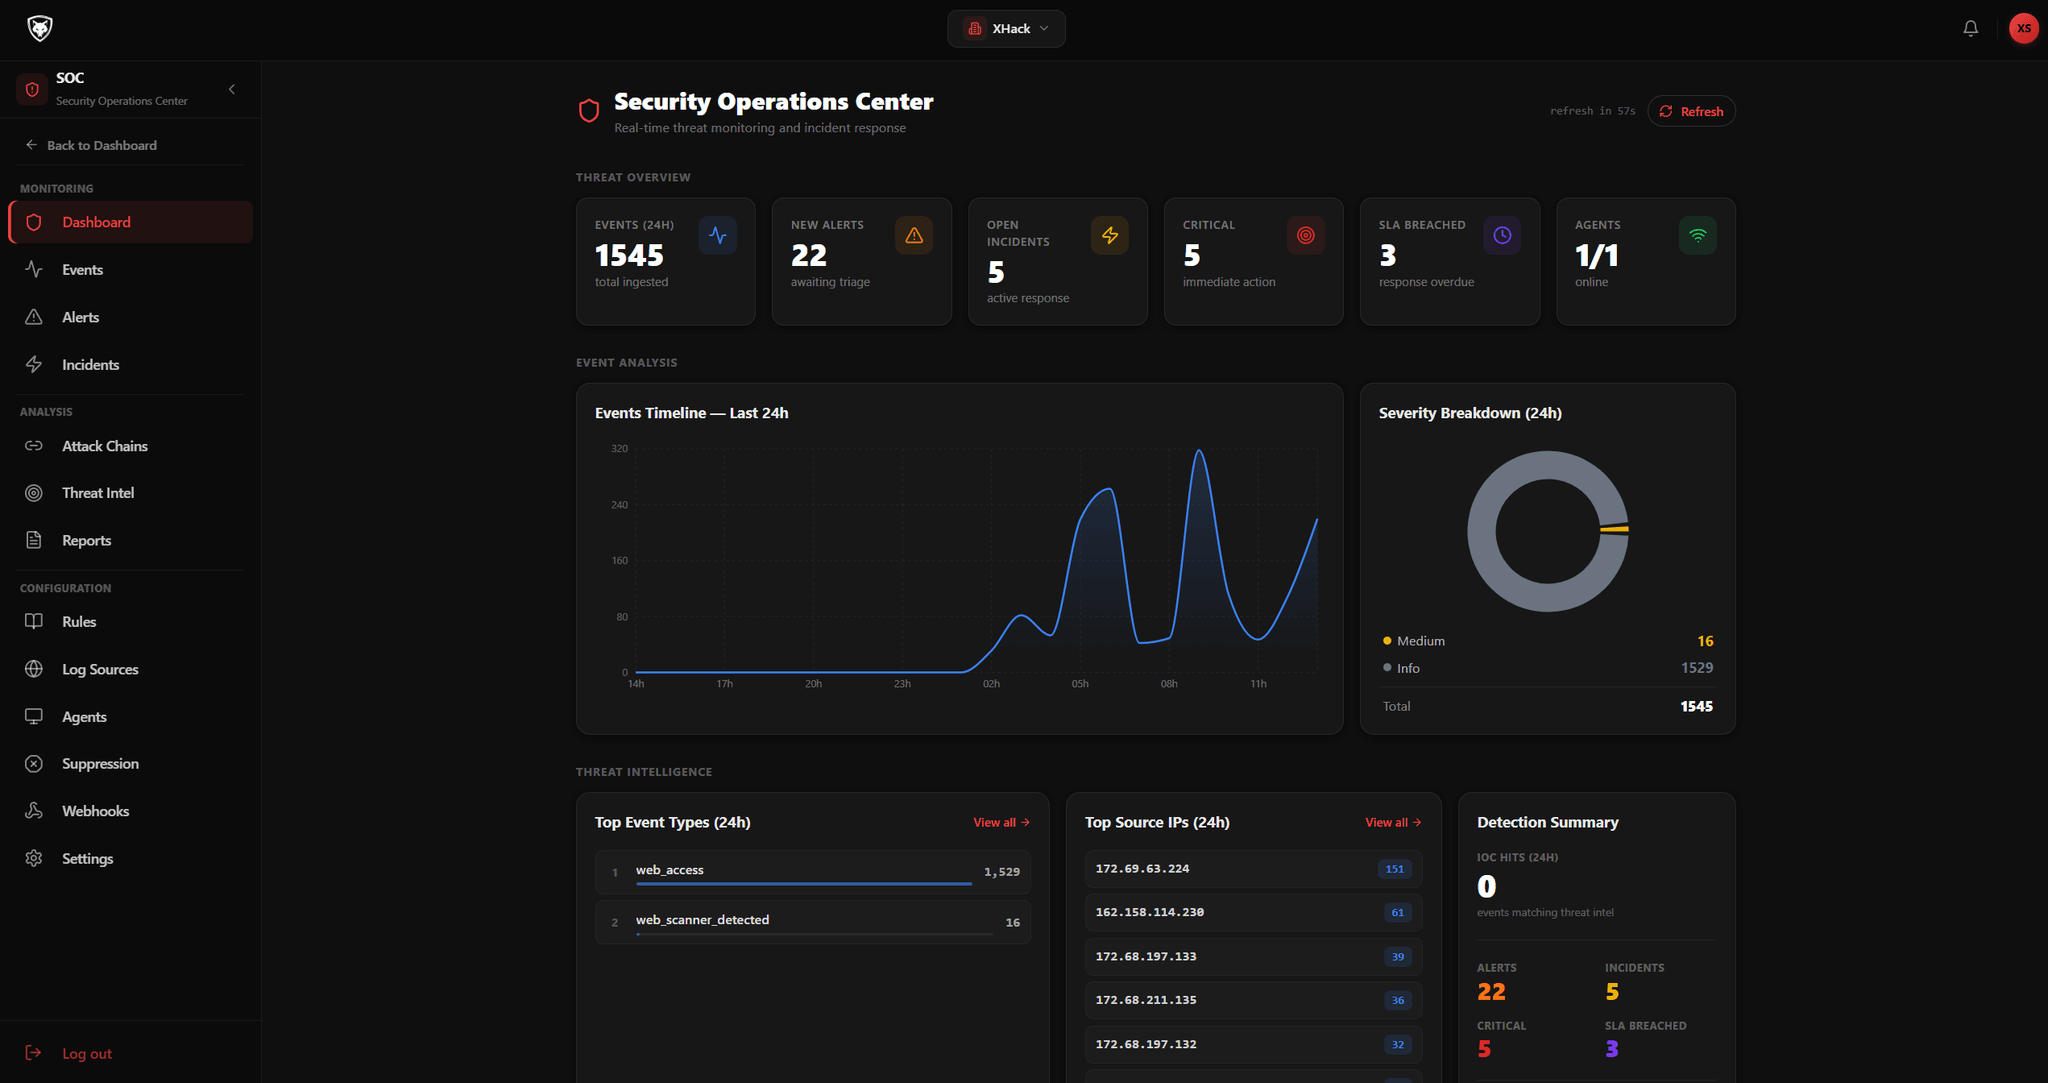
Real time
Events land as they happen
18
Detection rule operators
MITRE
ATT&CK mapped, end to end
SLA
Tracked on every incident
What it does
A full security operations centre, on one screen
Ingest everything, detect what matters, correlate the multi-stage attacks and run every incident to closure. Here is the whole product at a glance.
Multi-source ingestion
Cloudflare, Wazuh, webhooks and a lightweight log wrapper, all feeding one normalised event stream.
Detection rules engine
Eighteen operators, nested AND/OR logic, thresholds and AI-generated rules from plain English.
Alert stacking
Repeat hits from the same source collapse into one alert with a count, instead of hundreds of duplicates.
Attack chain detection
Correlates alerts into multi-stage attacks mapped to the MITRE ATT&CK kill chain.
MITRE ATT&CK
Events and alerts auto-mapped to tactics and techniques for a shared language across the team.
Incident management
A structured workflow from new to closed, with every contributing alert and event attached.
SLA tracking
Per-severity response targets, monitored automatically, with breach alerts in-app and by email.
Tenant-isolated data
Your events never leave your tenant. Configurable retention, hard deletes and a full audit trail.
See it in action
Watch the SOC Dashboard at work
A short walkthrough of ingestion, detection and incident response in the live console.
youtube.com / XHack SOC Dashboard
XHack SOC Dashboard walkthrough
Click to play
AI at the core
An AI analyst on everything you collect
XHack does not just store logs and match patterns. An AI analysis engine reads what comes in and explains it, across every event, every attack chain, every incident, and even the detection rules you create.
AI analysed
Every event
Each event is read in context, classified by severity and mapped to a MITRE technique, with the AI writing out why in plain language rather than just flagging a match.
AI analysed
Every attack chain
The engine explains how correlated events form a chain, which kill-chain stages they cover and what the attacker is most likely trying to achieve.
AI analysed
Every incident
Incidents arrive with an AI summary of what happened across the attached evidence, so a responder opening one sees the whole story, not a pile of raw alerts.
AI analysed
Every rule you write
Describe what you want to catch and the AI drafts a complete detection rule. It routinely adds thresholds and suppression you did not ask for, so the rule is more robust than the sentence you gave it.
Just say what you want to detect, then hit Generate
No rule syntax to learn. Write the threat in your own words and the AI returns a complete rule. It often hardens the logic beyond what you described, so you get a rule that holds up in production, not a literal translation of your sentence.
You describe it
“Alert me when one IP hits more than 20 different URLs and keeps getting 404s in five minutes. That is someone scanning us.”
Rapid 404 scanning from a single source
Severity
High
Match
status_code equals 404
Group by
source_ip
Threshold
20 distinct paths within 5 minutes
Action
Create alert, map to Reconnaissance
The AI added on its own
Distinct-path counting so one URL refreshed 20 times will not trigger it
Suppression for /_next/ and static assets to keep out framework noise
Illustrative example. Every generated rule is yours to edit, test and activate before it goes live.
How logs get in
Feed it from everything, all at once
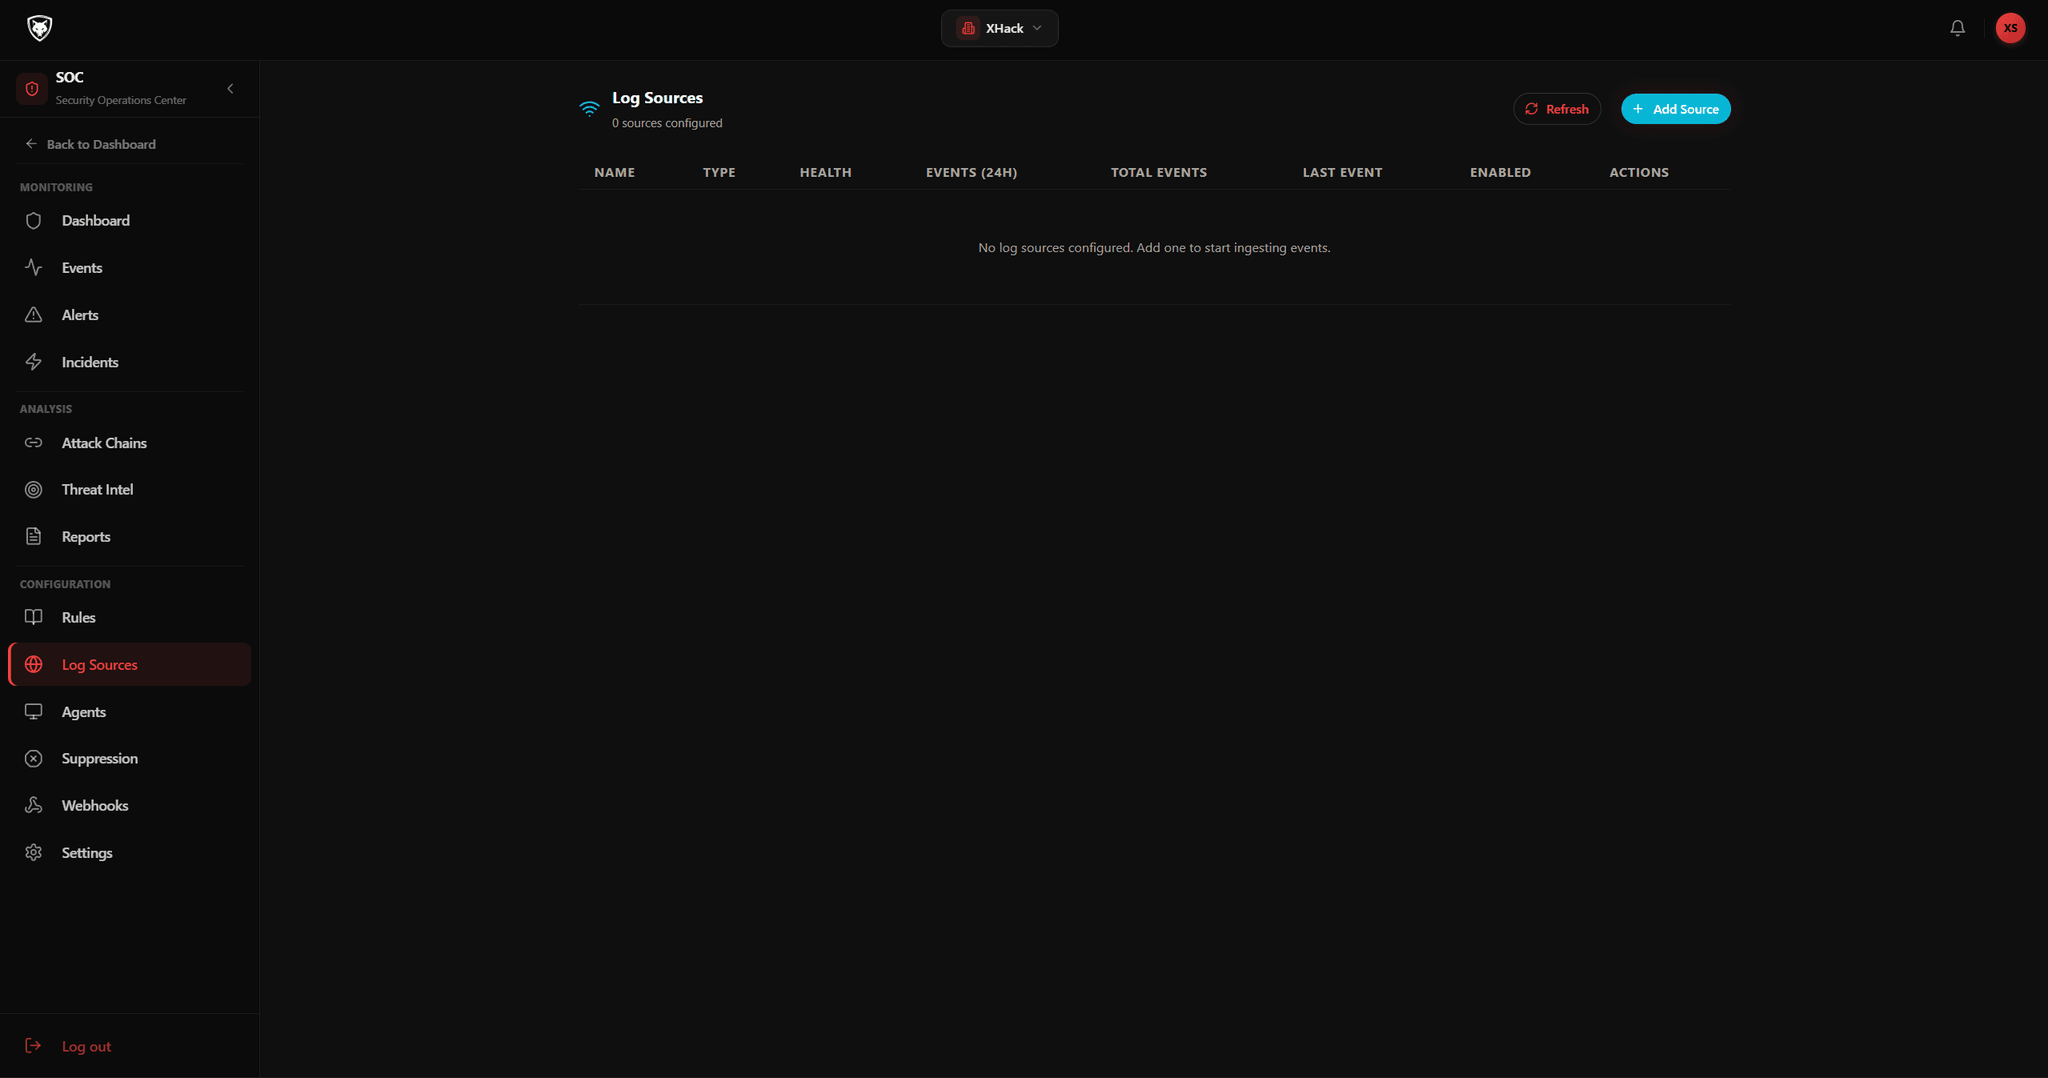
Four ingestion paths that can all run together. Whatever your infrastructure looks like, its security signal ends up in one normalised stream.
Cloudflare
Pull WAF blocks, firewall matches, bot detections and managed challenges straight from your zones. Add an API token and zone ID, and events flow in normalised automatically.
Wazuh
Connect your Wazuh manager to ingest alerts, file-integrity events, vulnerability detections and agent data. If you already run Wazuh, data flows within minutes.
Webhook forwarding
Build custom pipelines with n8n, Tines or any HTTP-capable tool. POST events to the XHack log API in a supported format and they are ingested immediately.
XHack log wrapper
A lightweight forwarder you deploy in your own environment to ship access logs, application events and authentication events directly to your SOC account.
soc / log sources
Detection rules engine
Alert on your threat model, not someone else's
Full control over what fires. Build precise logic by hand, or describe it in plain English and let the AI write the rule for you to review.
soc / detection rules
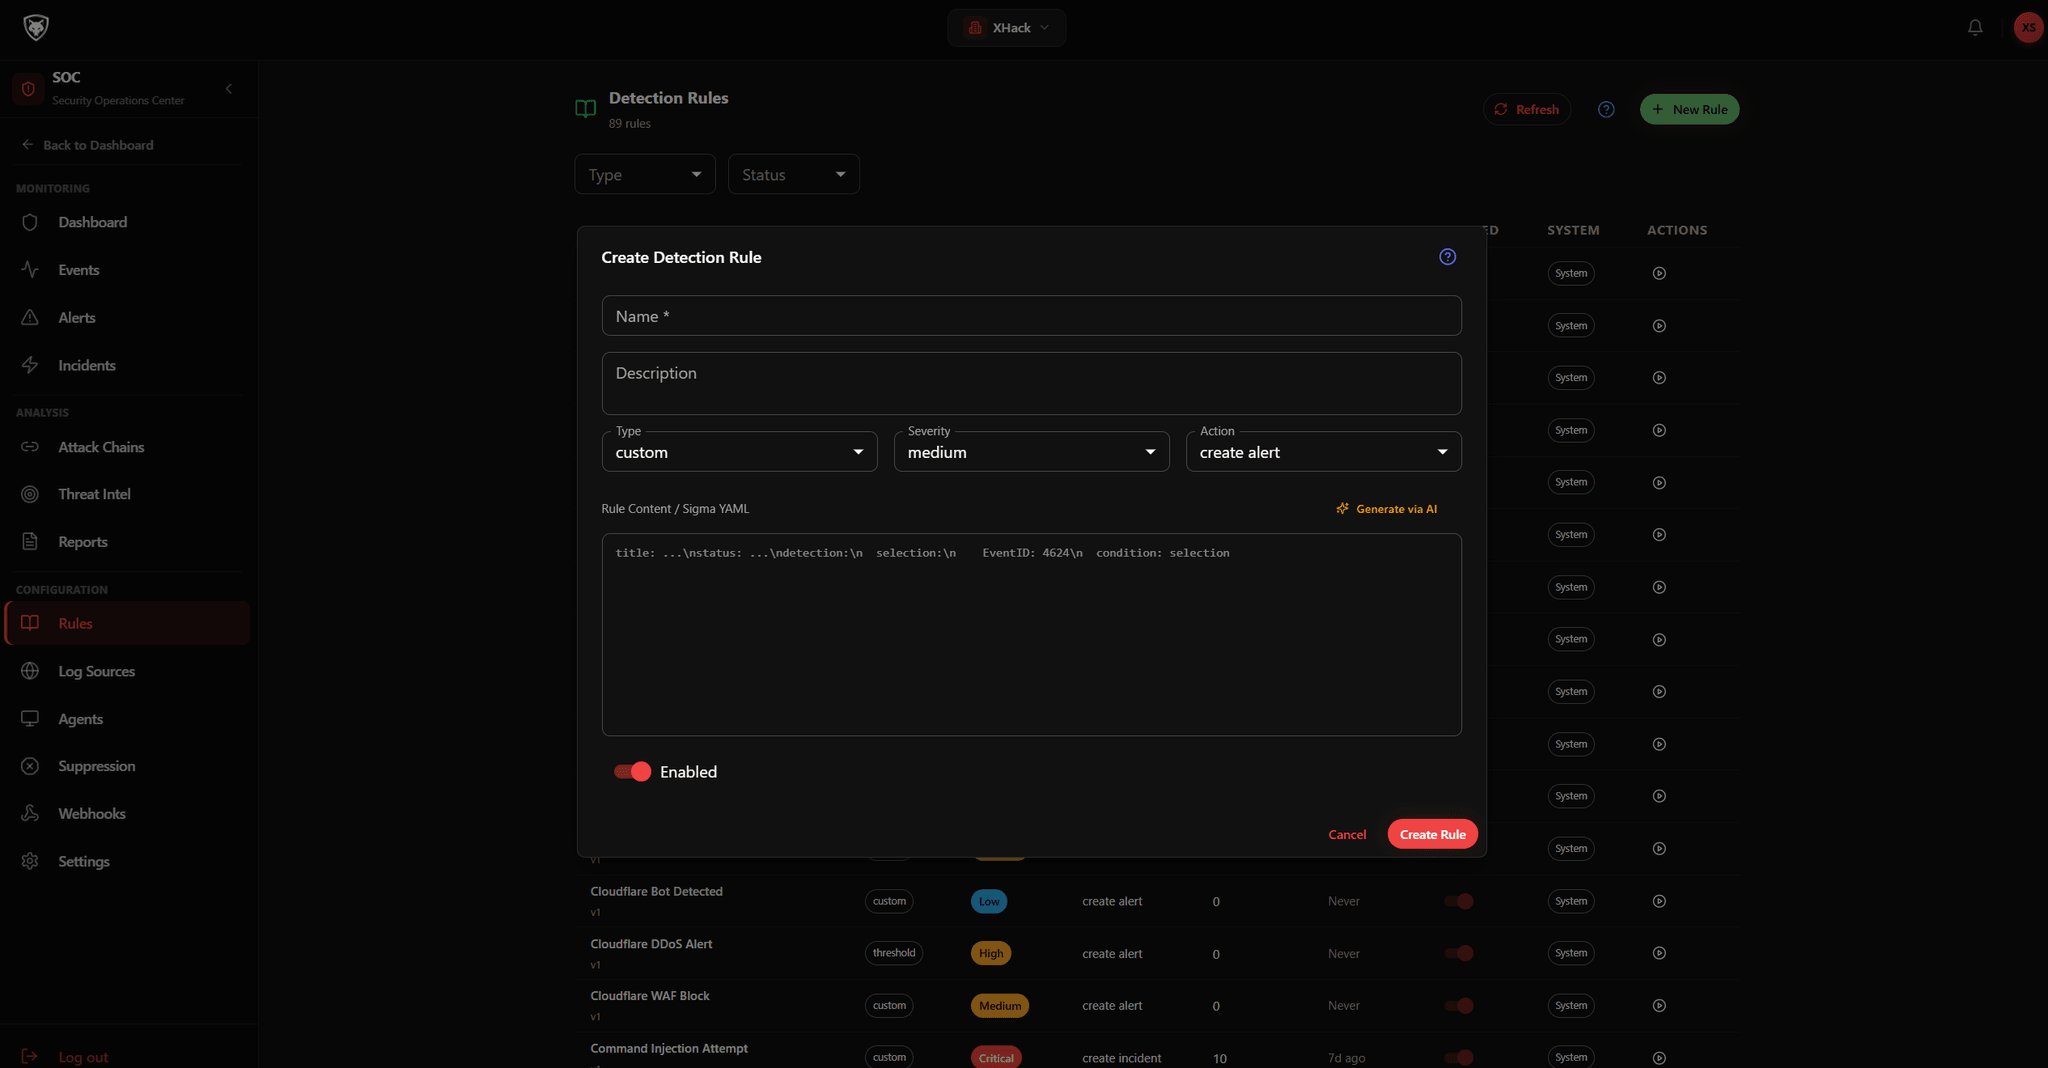
18 operators
Exact match, contains, starts with, regex, numeric comparisons, exists checks and every negated form.
Nested AND / OR
Group conditions into complex detection logic that matches real-world attack patterns, not single strings.
Threshold rules
Fire only when a condition is met N times in a window. Twenty scanner hits from one IP in five minutes, not one.
Framework-aware suppression
Exclude /_next/, /_nuxt/, /static/ and asset extensions so rules fire on attacks, not on page navigations.
AI-assisted generation
Describe what you want to catch in plain English and the AI writes the full rule, ready for review.
Review before it runs
Every generated rule arrives with conditions, severity and action laid out, so nothing goes live unseen.
Ships with detection out of the box
Pre-built rules cover the attacks you would write first anyway, so you have coverage from day one and tune from there.
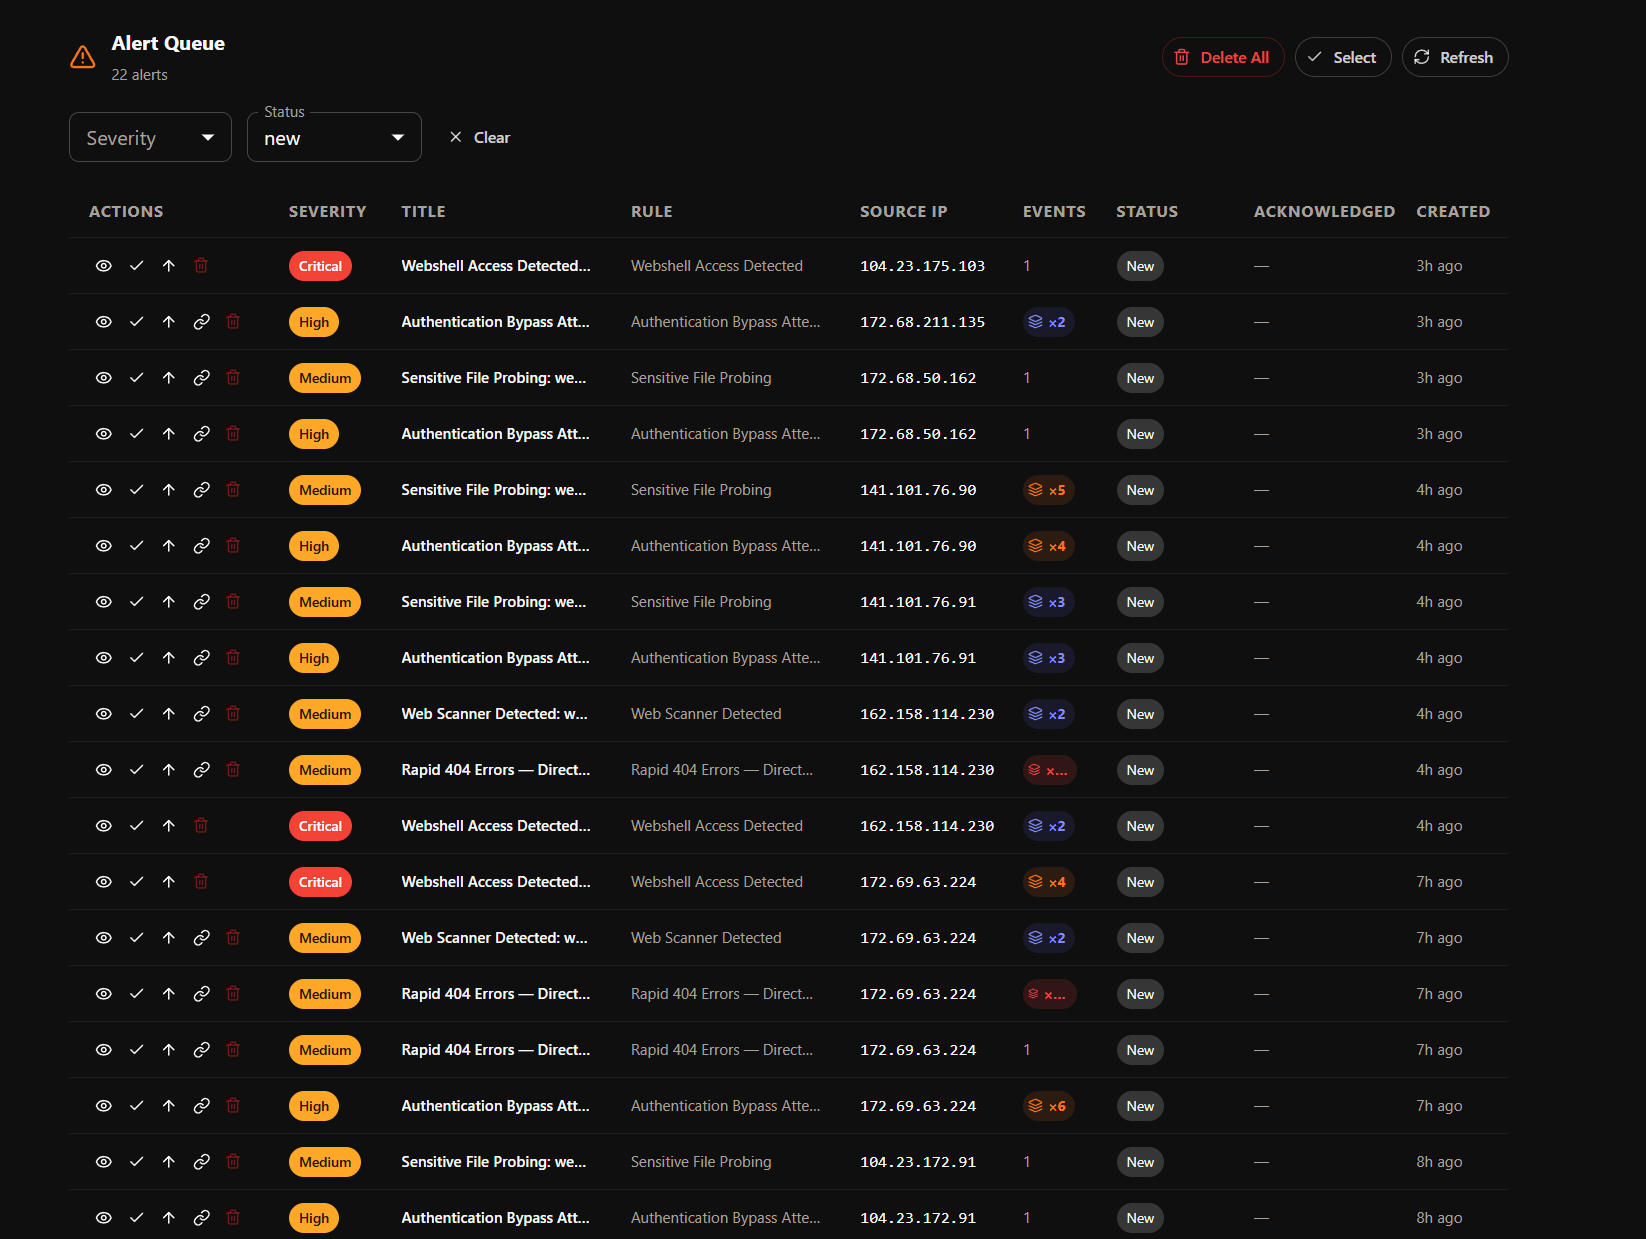
soc / alerts
Cut through the noise
One alert, not a thousand
When the same rule fires for the same source inside a six-hour window, XHack stacks the events into one alert with a count badge instead of flooding your queue with duplicates.
A count badge shows how many events an alert contains, expandable to every individual event, timestamp and raw payload.
If a higher-severity event joins the stack, the alert severity escalates automatically.
Link a stack to an incident and every event comes with it, so no evidence is lost.
Remove an unrelated event from a stack to keep the investigation clean.
Attack chain detection
See the attack, not just the alerts
Individual alerts tell you what happened. Attack chains tell you what is happening, and where it is headed. XHack correlates related indicators into multi-stage attacks mapped to MITRE ATT&CK.
01
Reconnaissance
02
Initial Access
03
Execution
04
Persistence
05
Privilege Escalation
06
Lateral Movement
07
Exfiltration
soc / attack chains
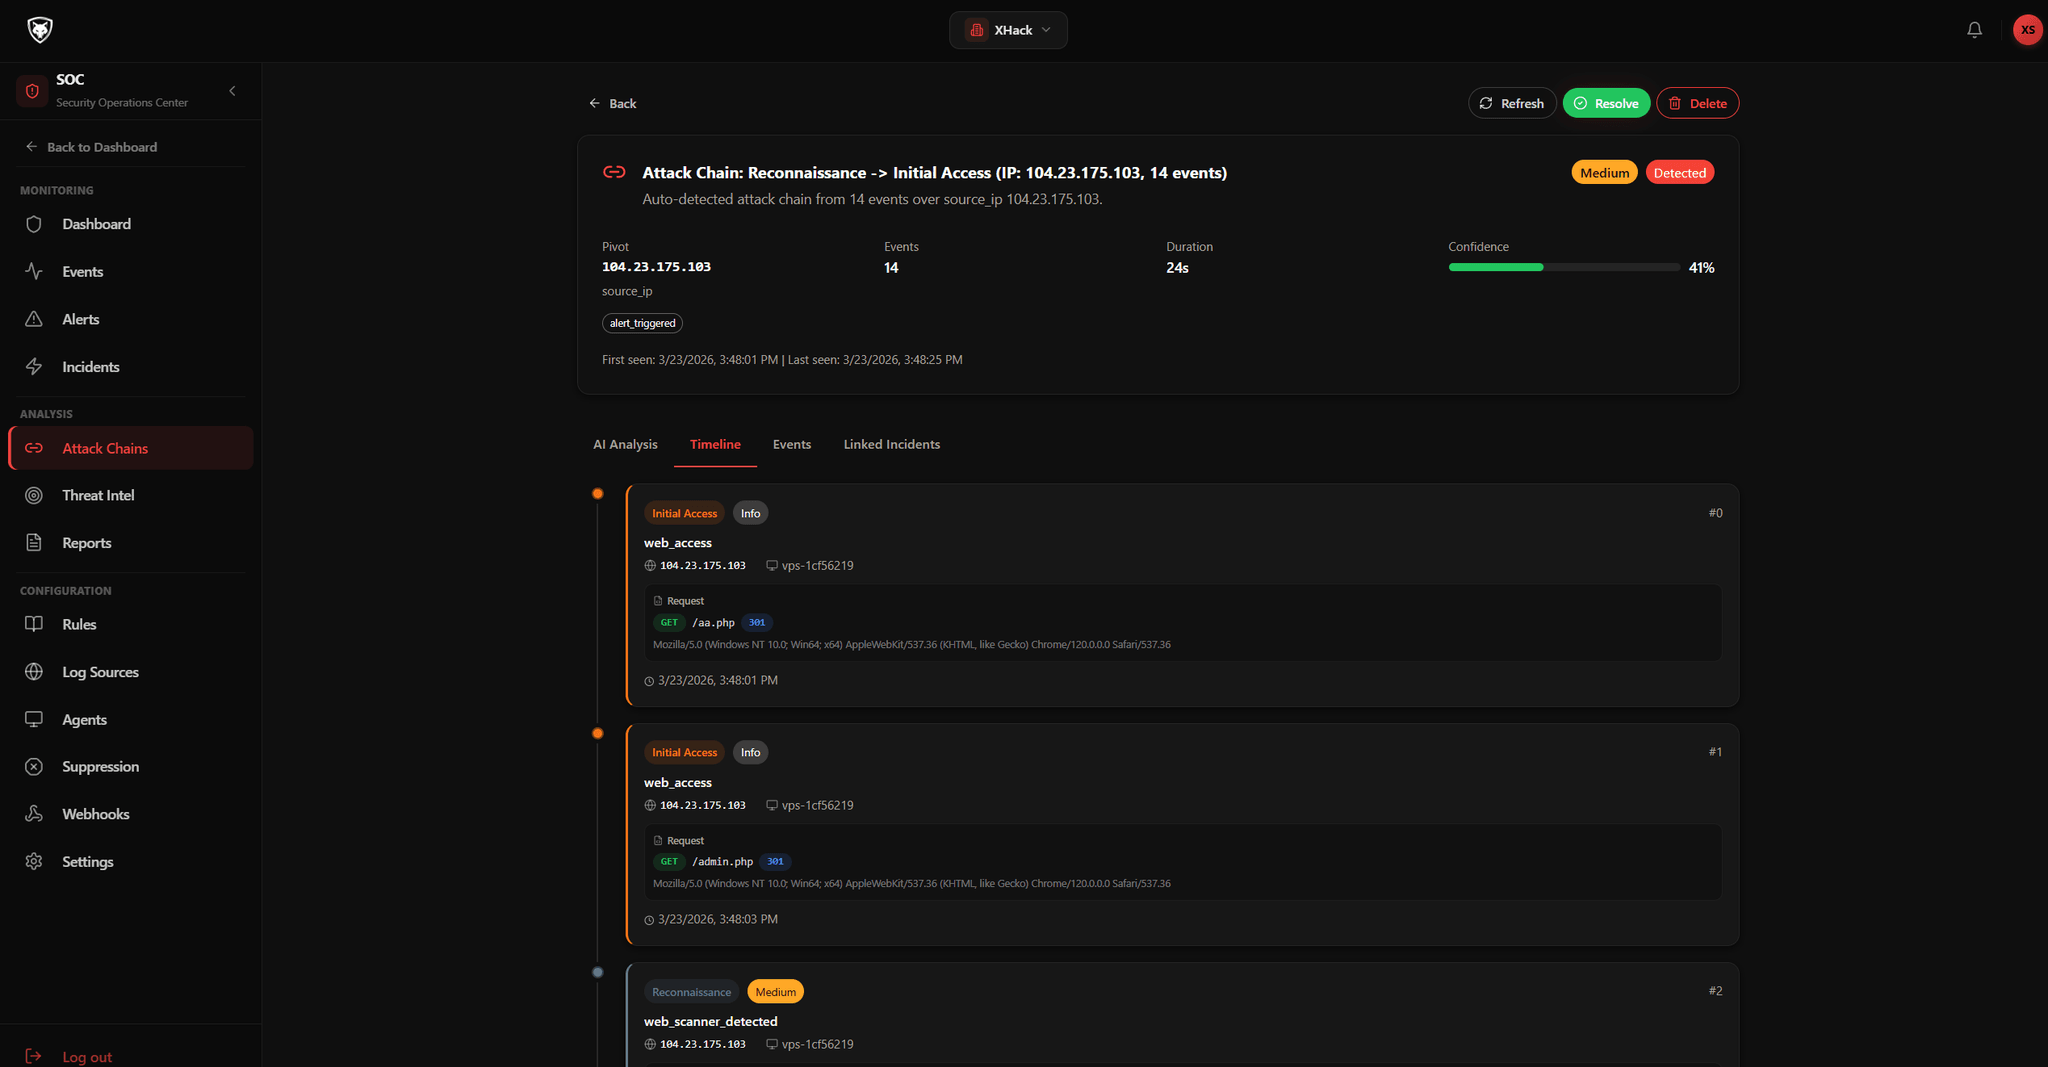
Continuous correlation
The engine watches alerts and events across your environment for multi-stage patterns, not one-off hits.
Severity that reflects reach
A chain spanning execution and exfiltration is classified differently from one showing only reconnaissance.
Configurable time window
A chain forms when two or more stages appear from related indicators inside the window you set.
The higher-level view
Follow sophisticated attacks that cross multiple events, systems and hours in a single picture.
Backed by a synchronised MITRE ATT&CK framework
Events and alerts are auto-mapped to tactics and techniques, giving your team a shared language and a direct link to MITRE documentation for every classified event. The same tactic mappings drive attack chain detection, deciding which kill chain stage each event belongs to.
Incident management
From detection to resolution, tracked
When events escalate into a confirmed incident, a structured workflow carries it to closure with every piece of evidence attached.
soc / incident
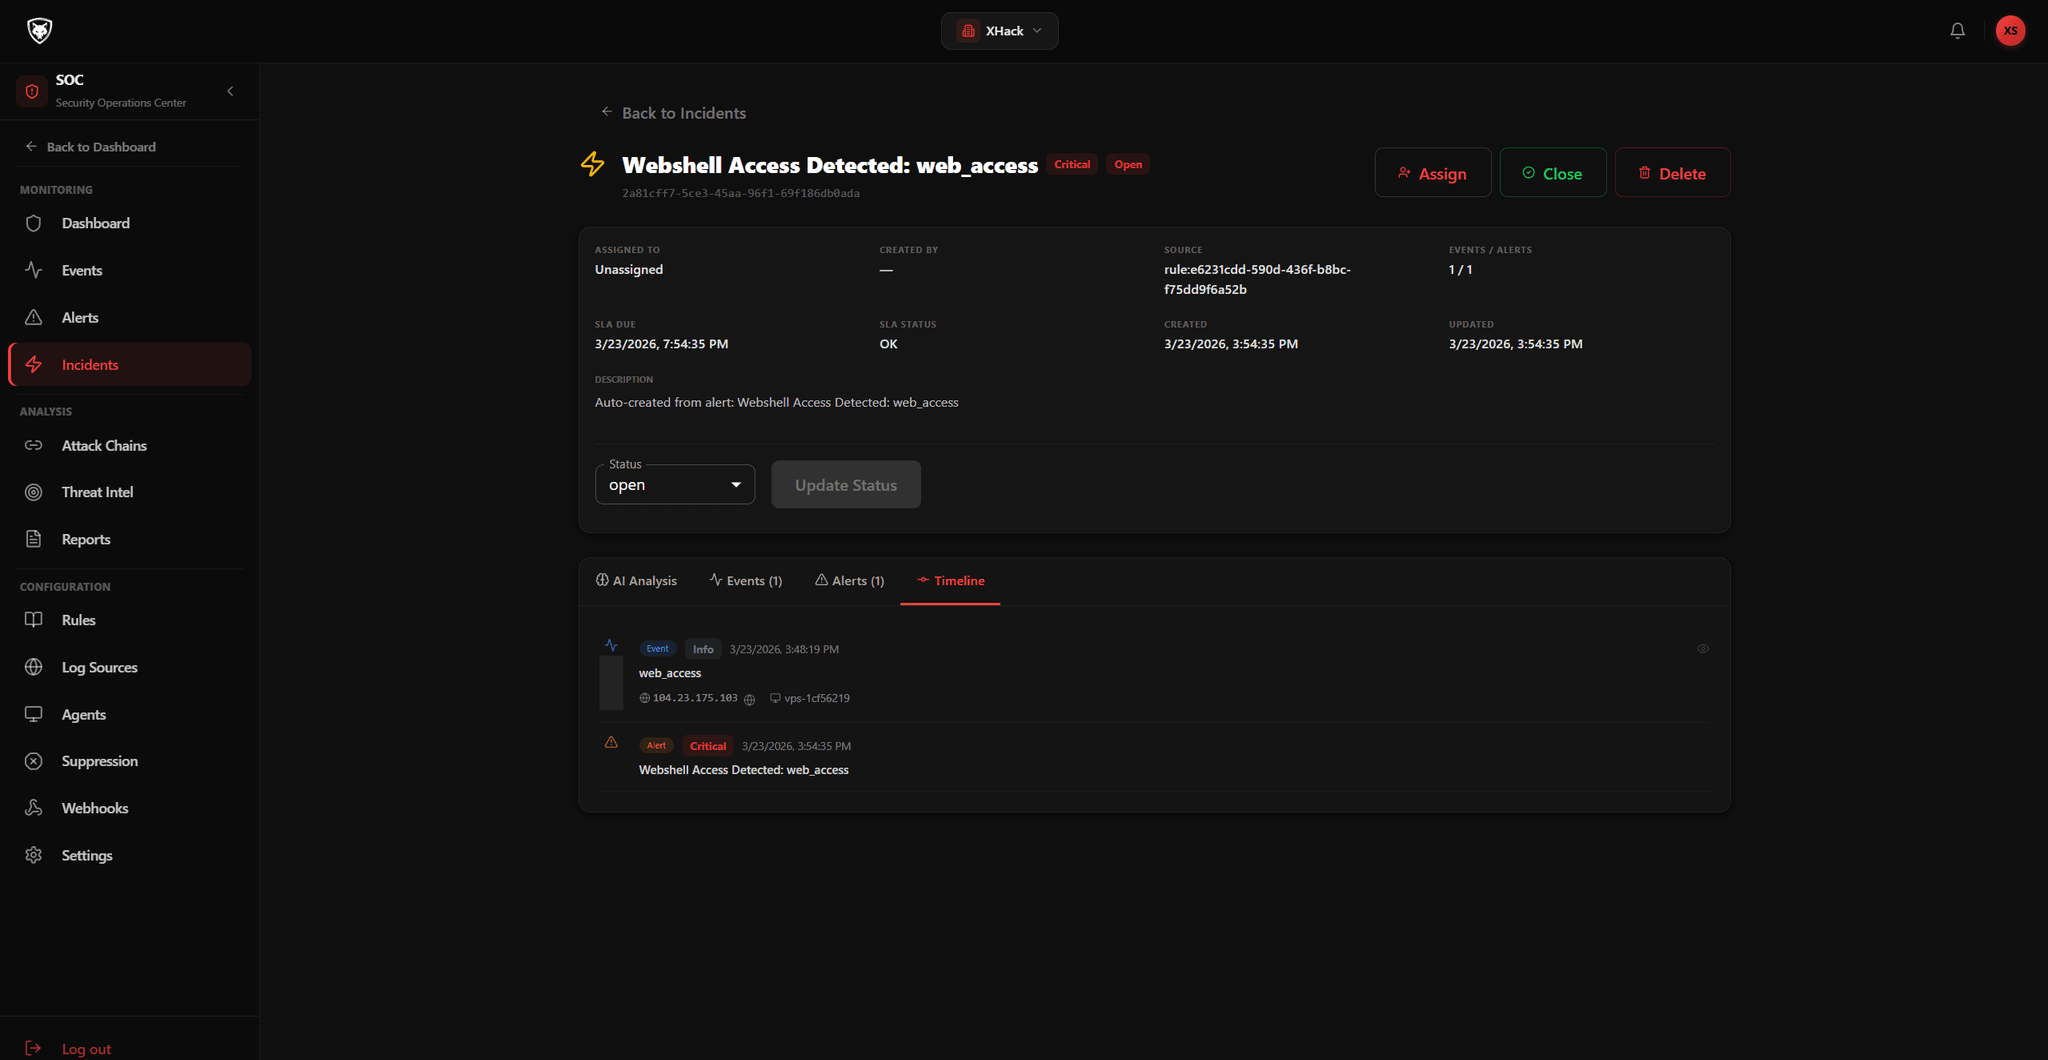
Incidents are created manually or automatically by a rule. Each one carries a severity, an assignee, a status and a complete timeline of every alert, event and action taken. Link alerts and events at any time and the whole picture stays connected.
SLA response targets
Critical
4 hours
High
24 hours
Medium
72 hours
Low
168 hours
Open incidents are monitored against these targets automatically. A breach raises an in-app notification and an email alert. Targets are yours to configure.
Informed, never overwhelmed
Email digests are rate-limited to two per hour per tenant, for only the severities you choose.
Incident and alert notifications are configured independently, so different people carry different noise levels.
In-app notifications appear instantly for new incidents and SLA breaches, each linking straight to the relevant page.
Your data, under your control
Events are processed in your isolated tenant and are never visible to another organisation.
You set retention periods and manage data by date range or severity, individually or in bulk.
Deletions are hard deletes that free your plan quota immediately, and every one is written to the audit trail.
The rest of the console
Everything else the SOC gives you
Agents, reports, suppressions, webhooks, threat intelligence and role-based settings, all in the same workspace.
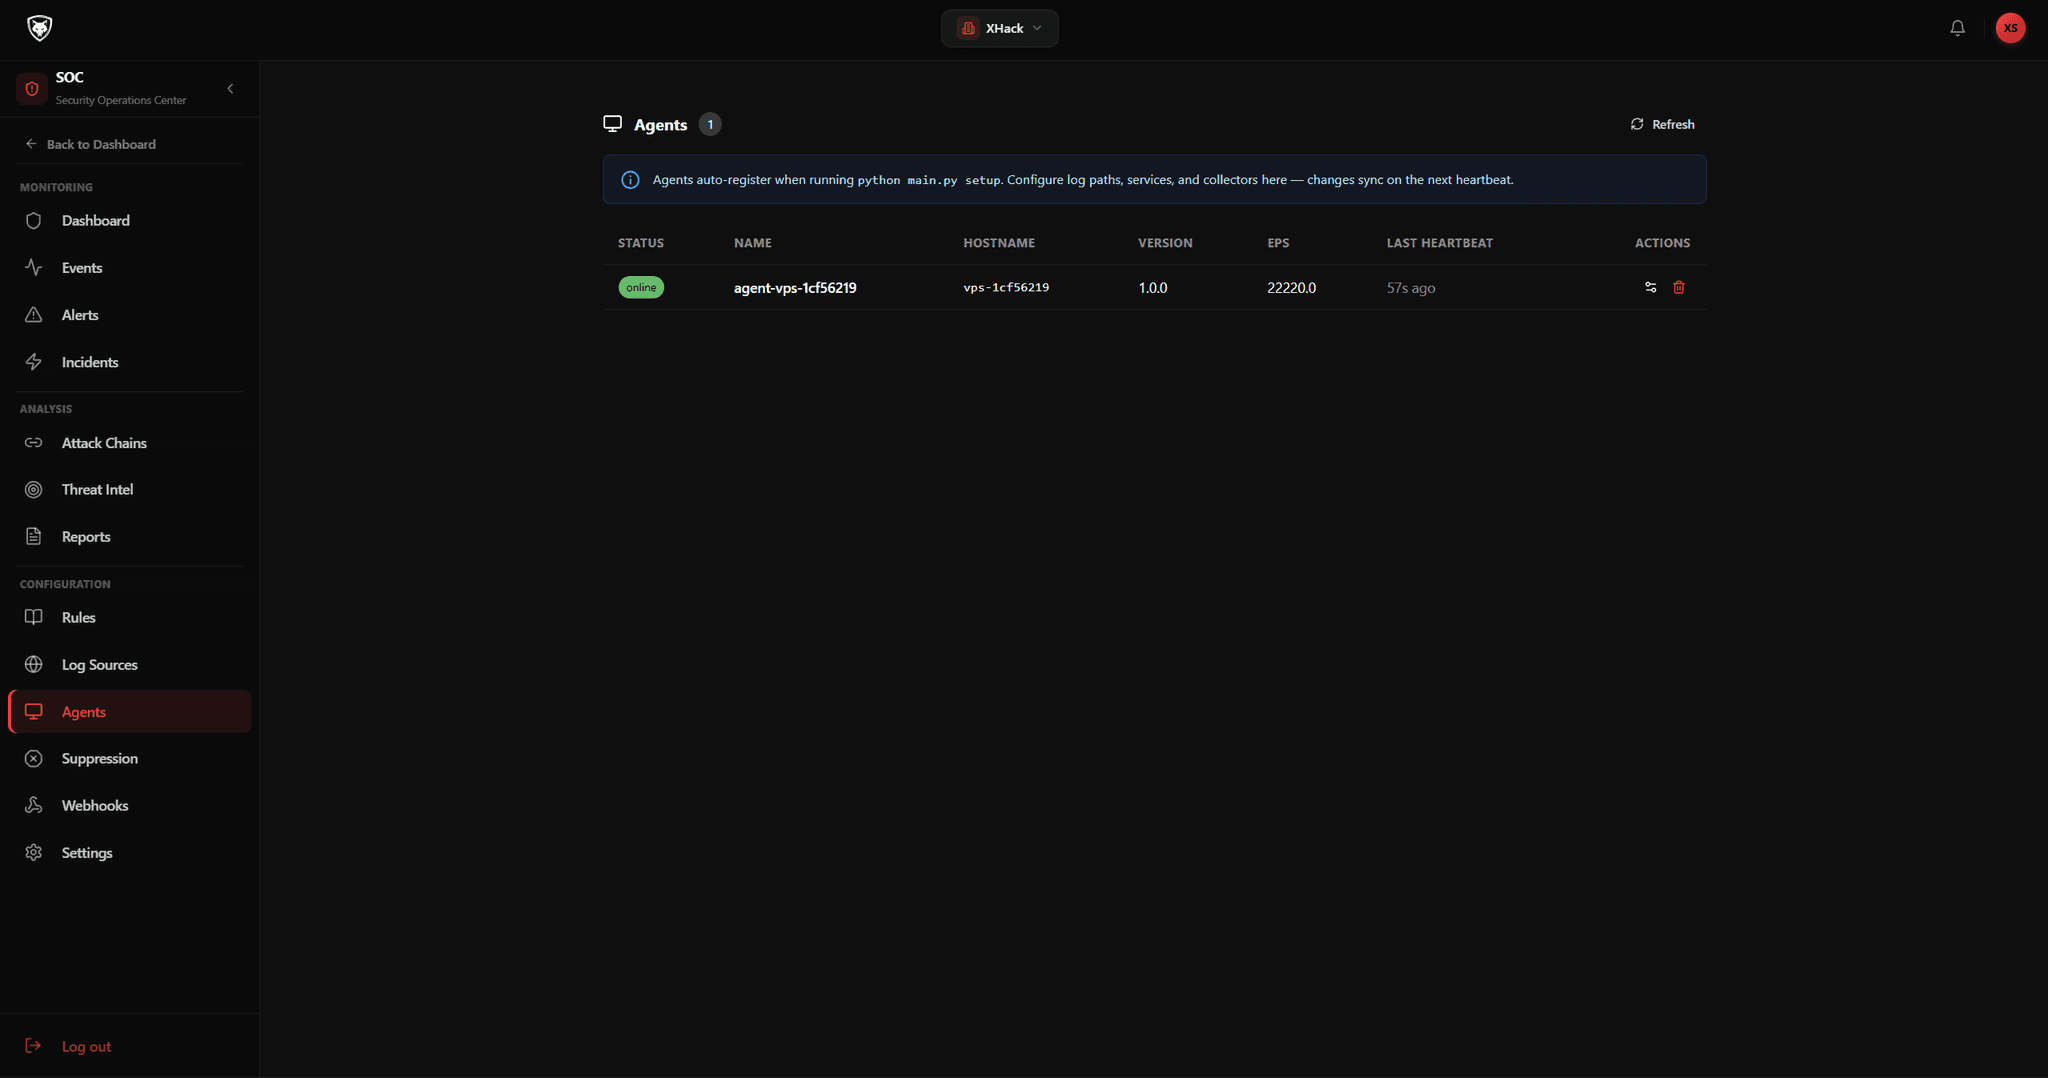
SOC agents
Deploy and configure the agents that forward and enrich data from across your estate.
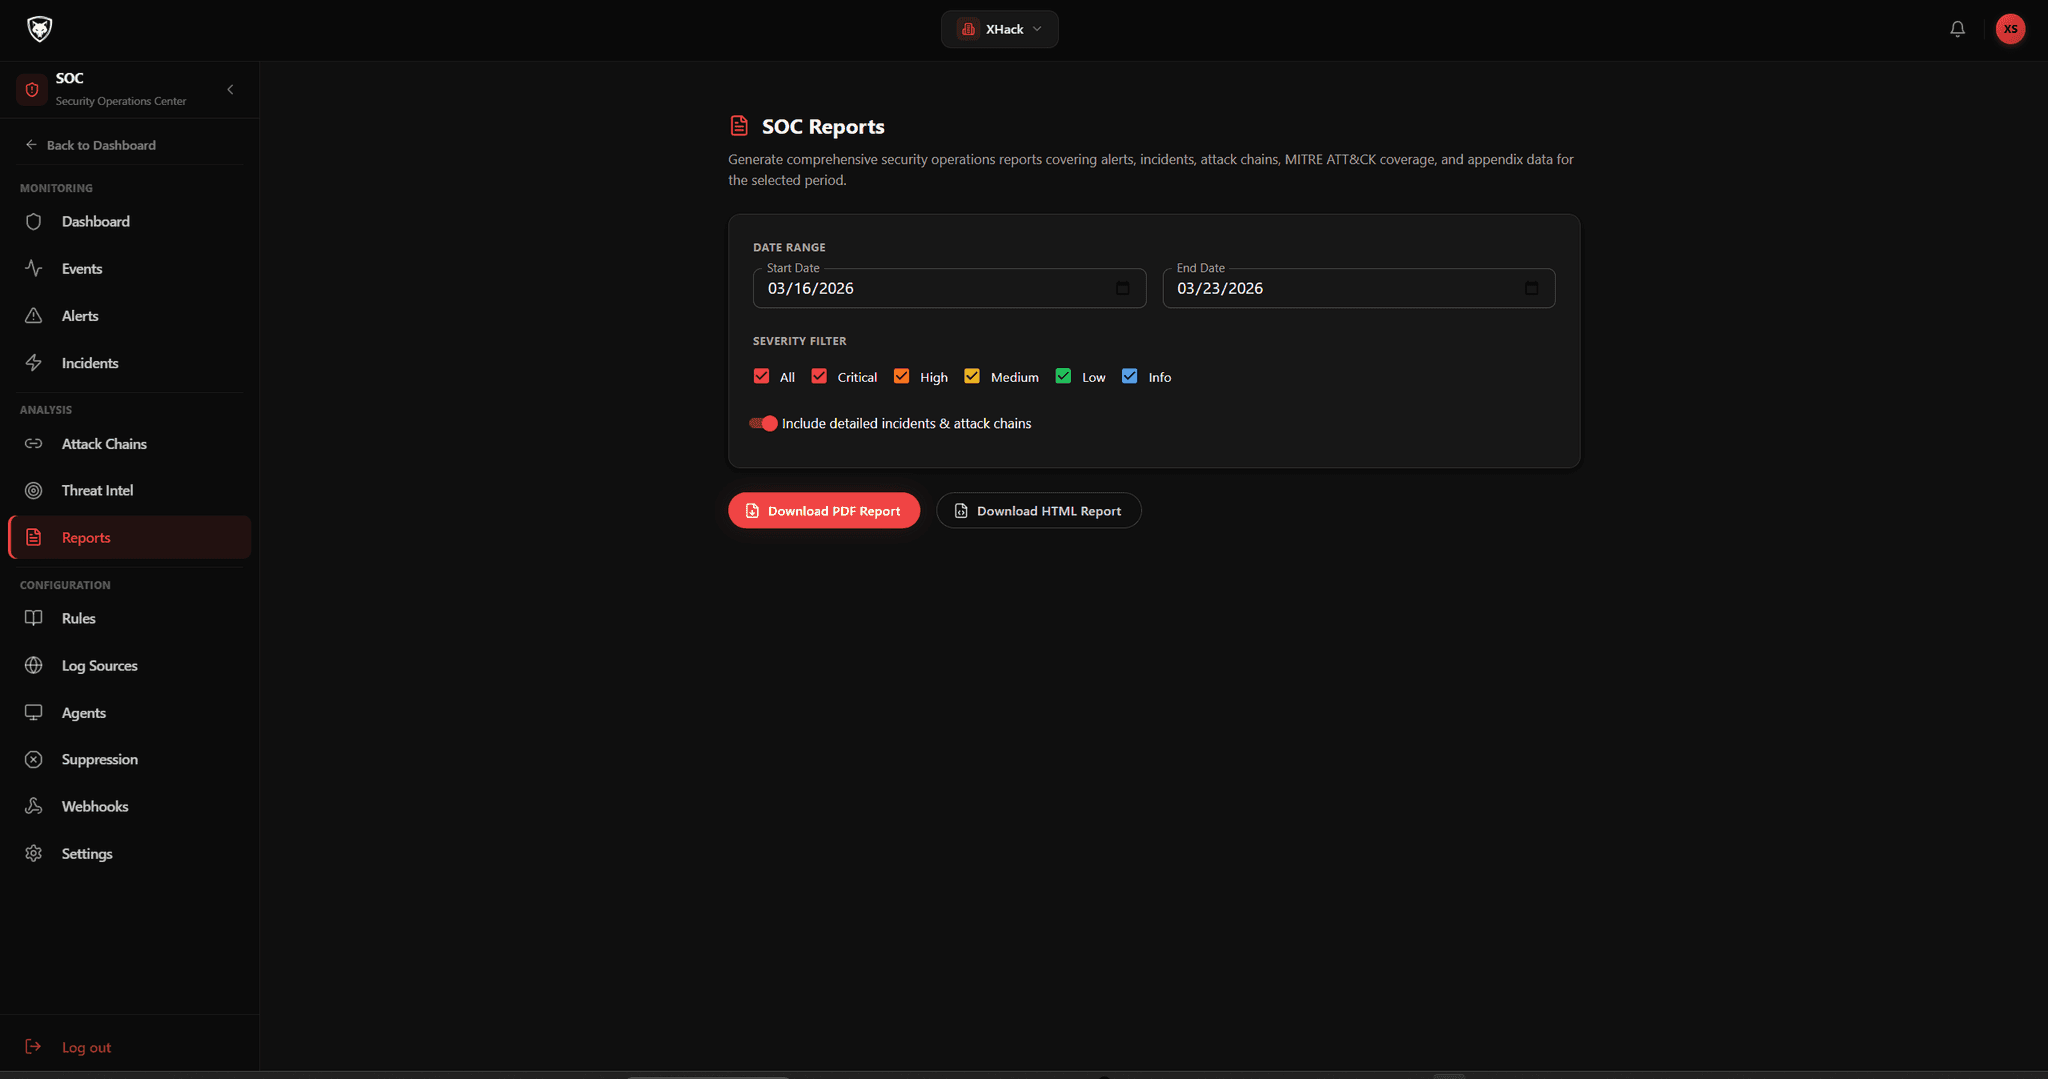
Reports
Generate shareable security reports for leadership, auditors and your own retrospectives.
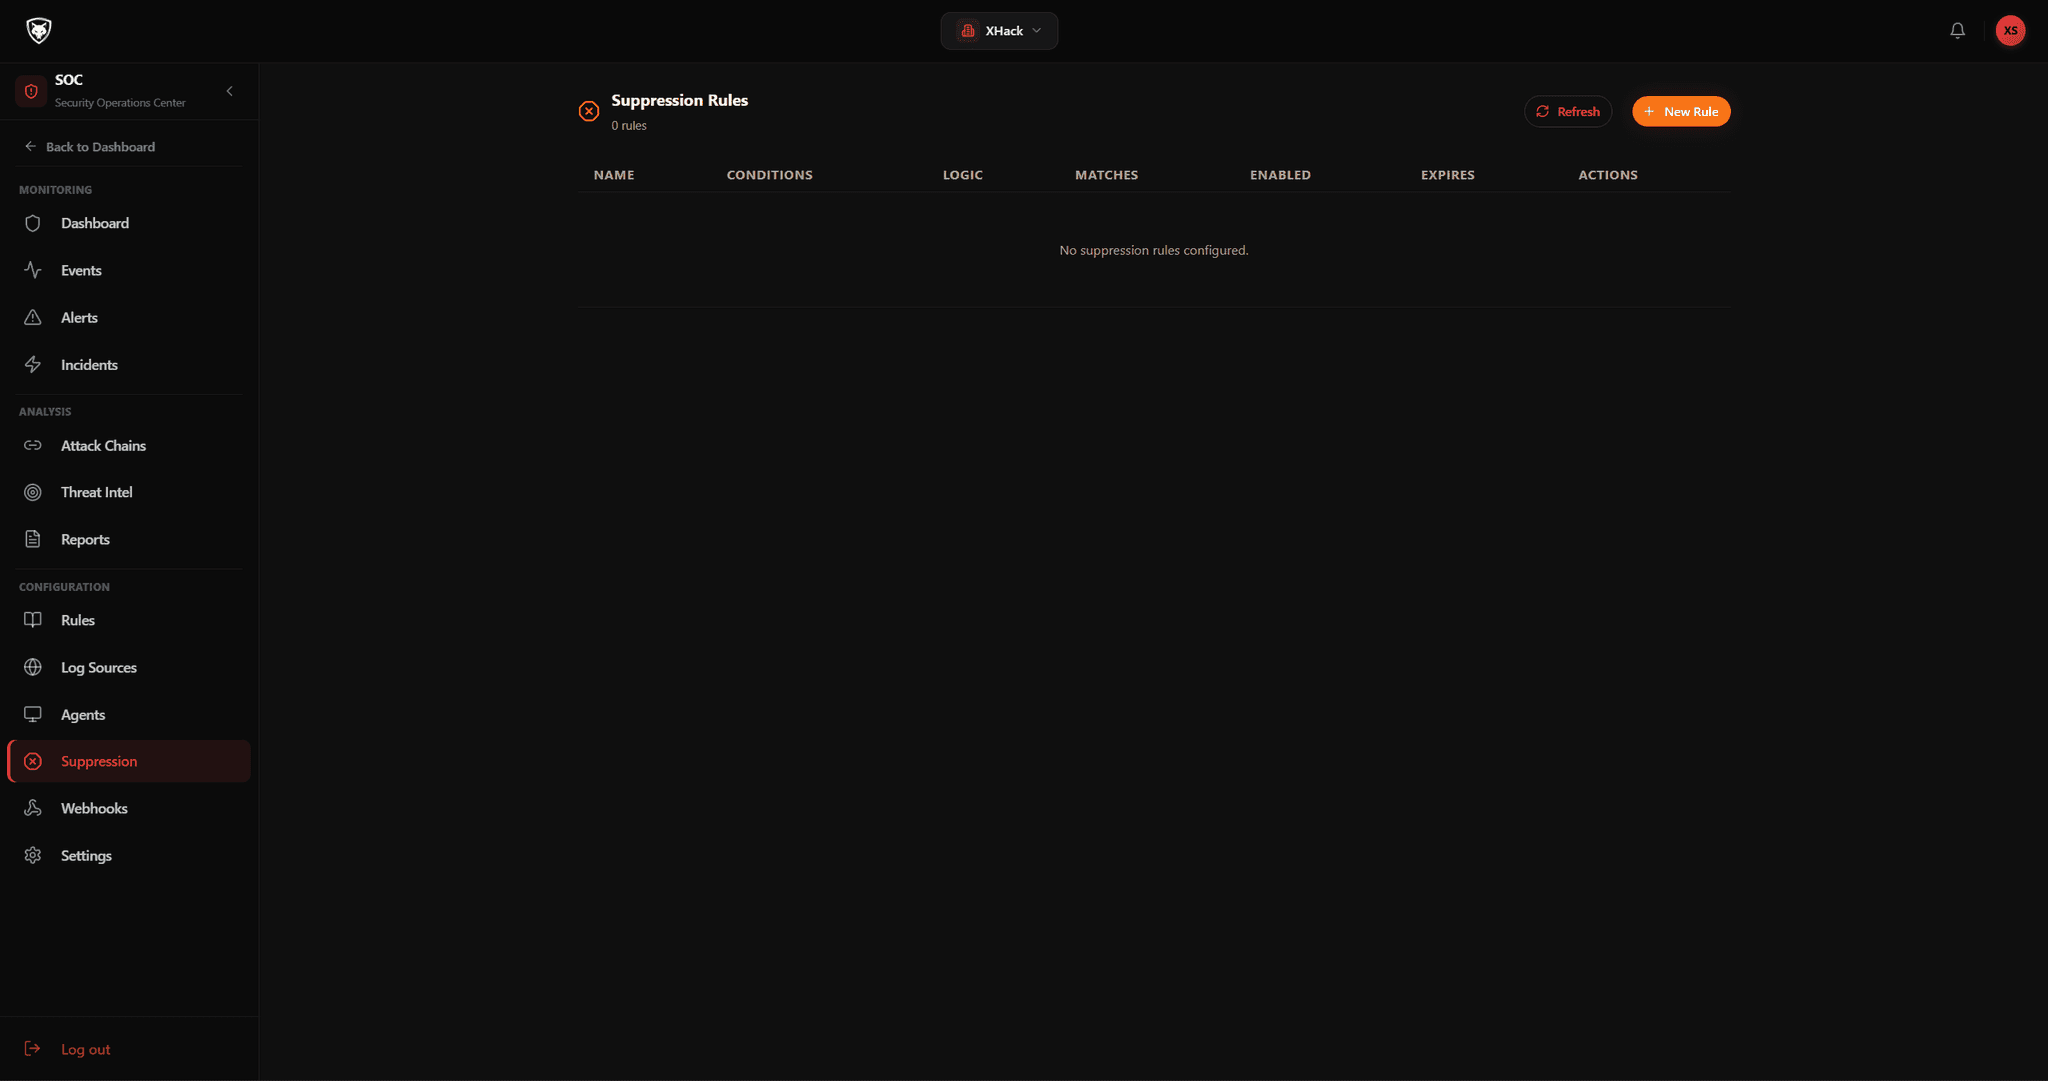
Suppressions
Tune out the known-good so real signal stays loud, with every suppression logged.
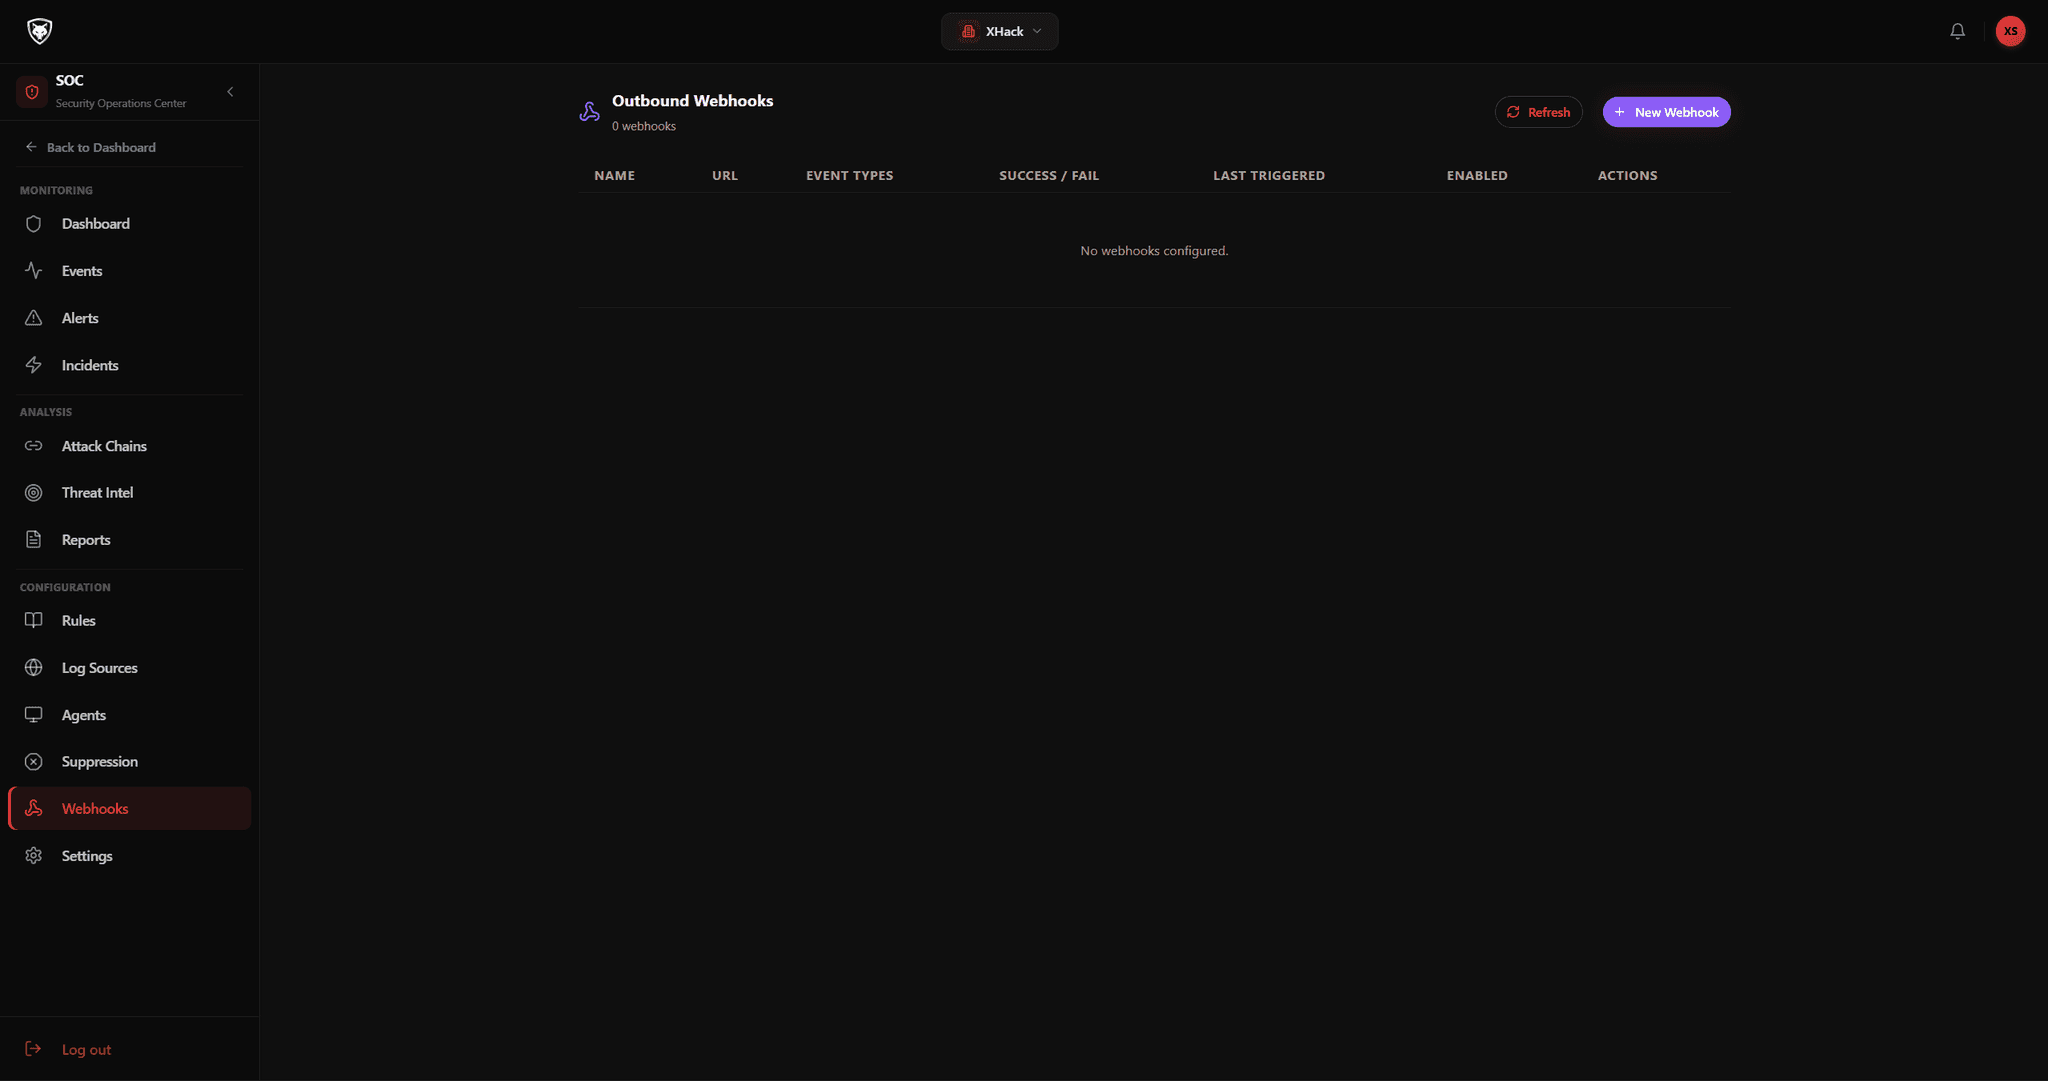
Webhooks
Wire the SOC into the rest of your tooling with inbound and outbound webhooks.
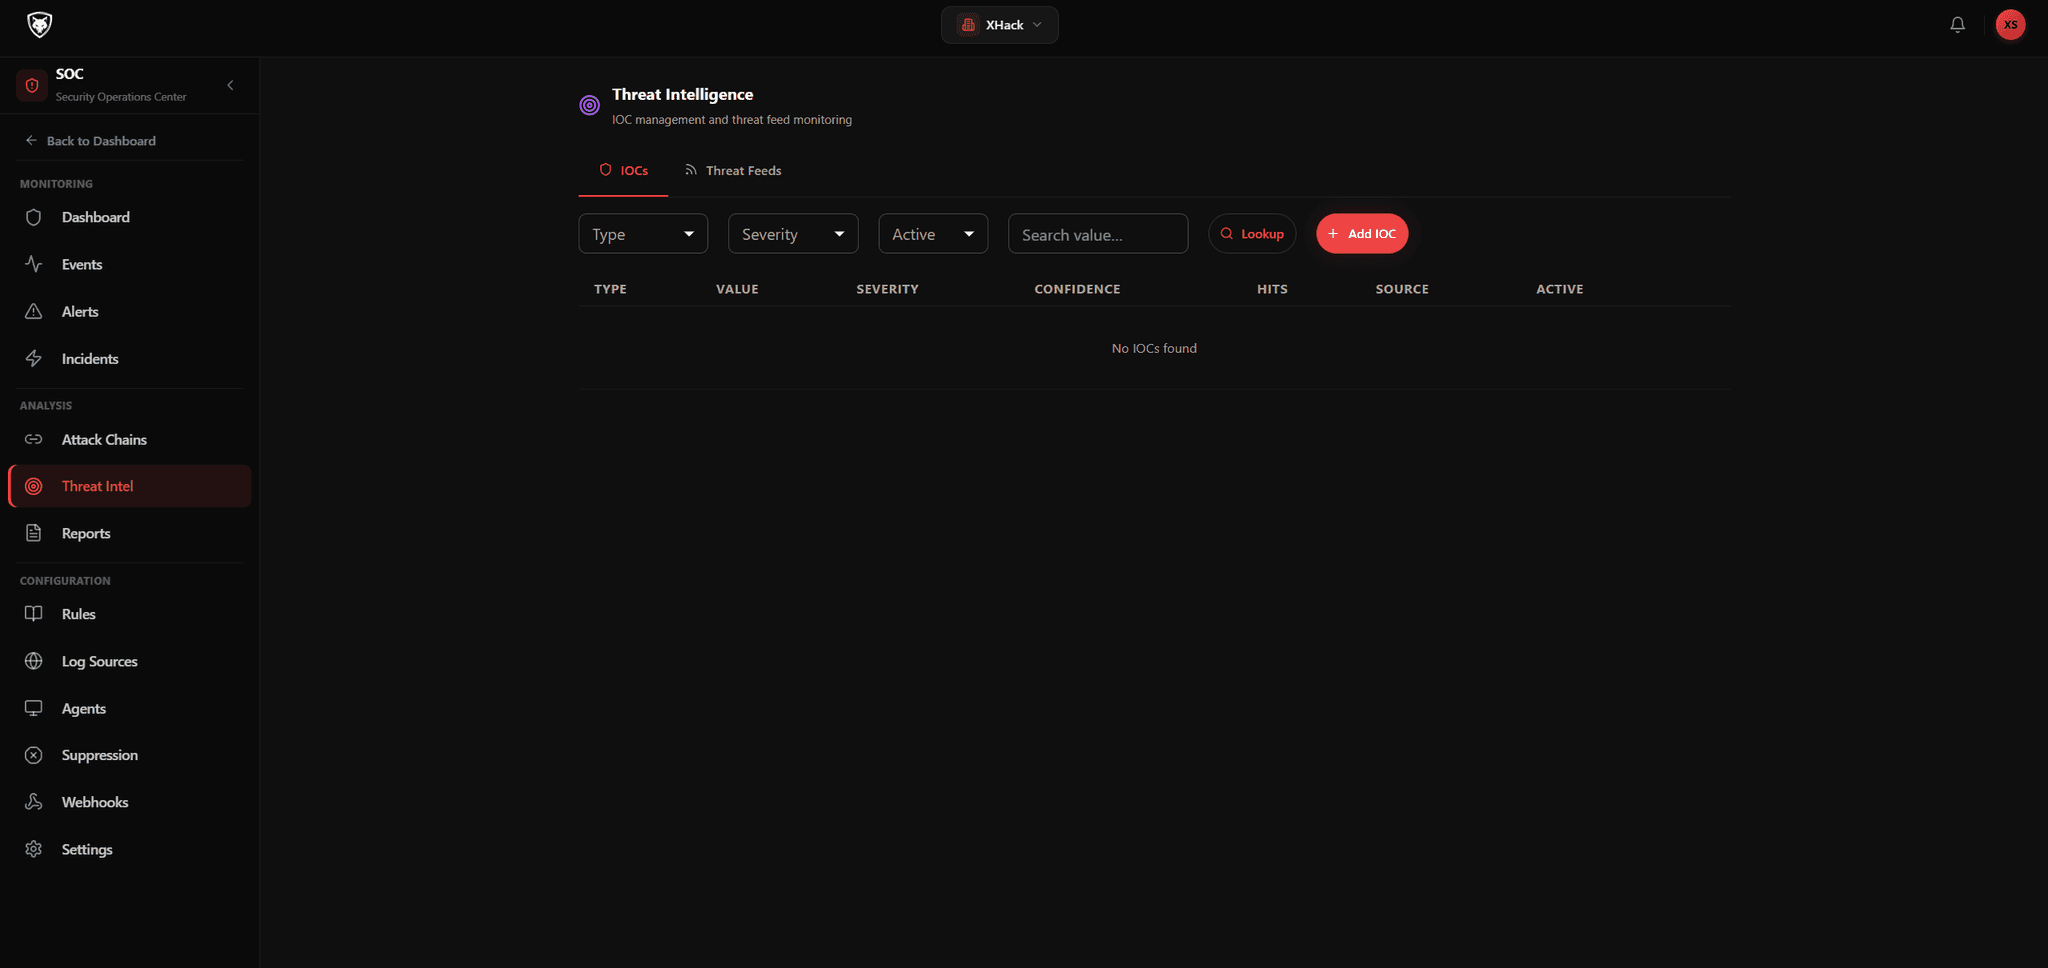
Threat intelligence
A synchronised MITRE ATT&CK reference and intel feeds behind every classified event.
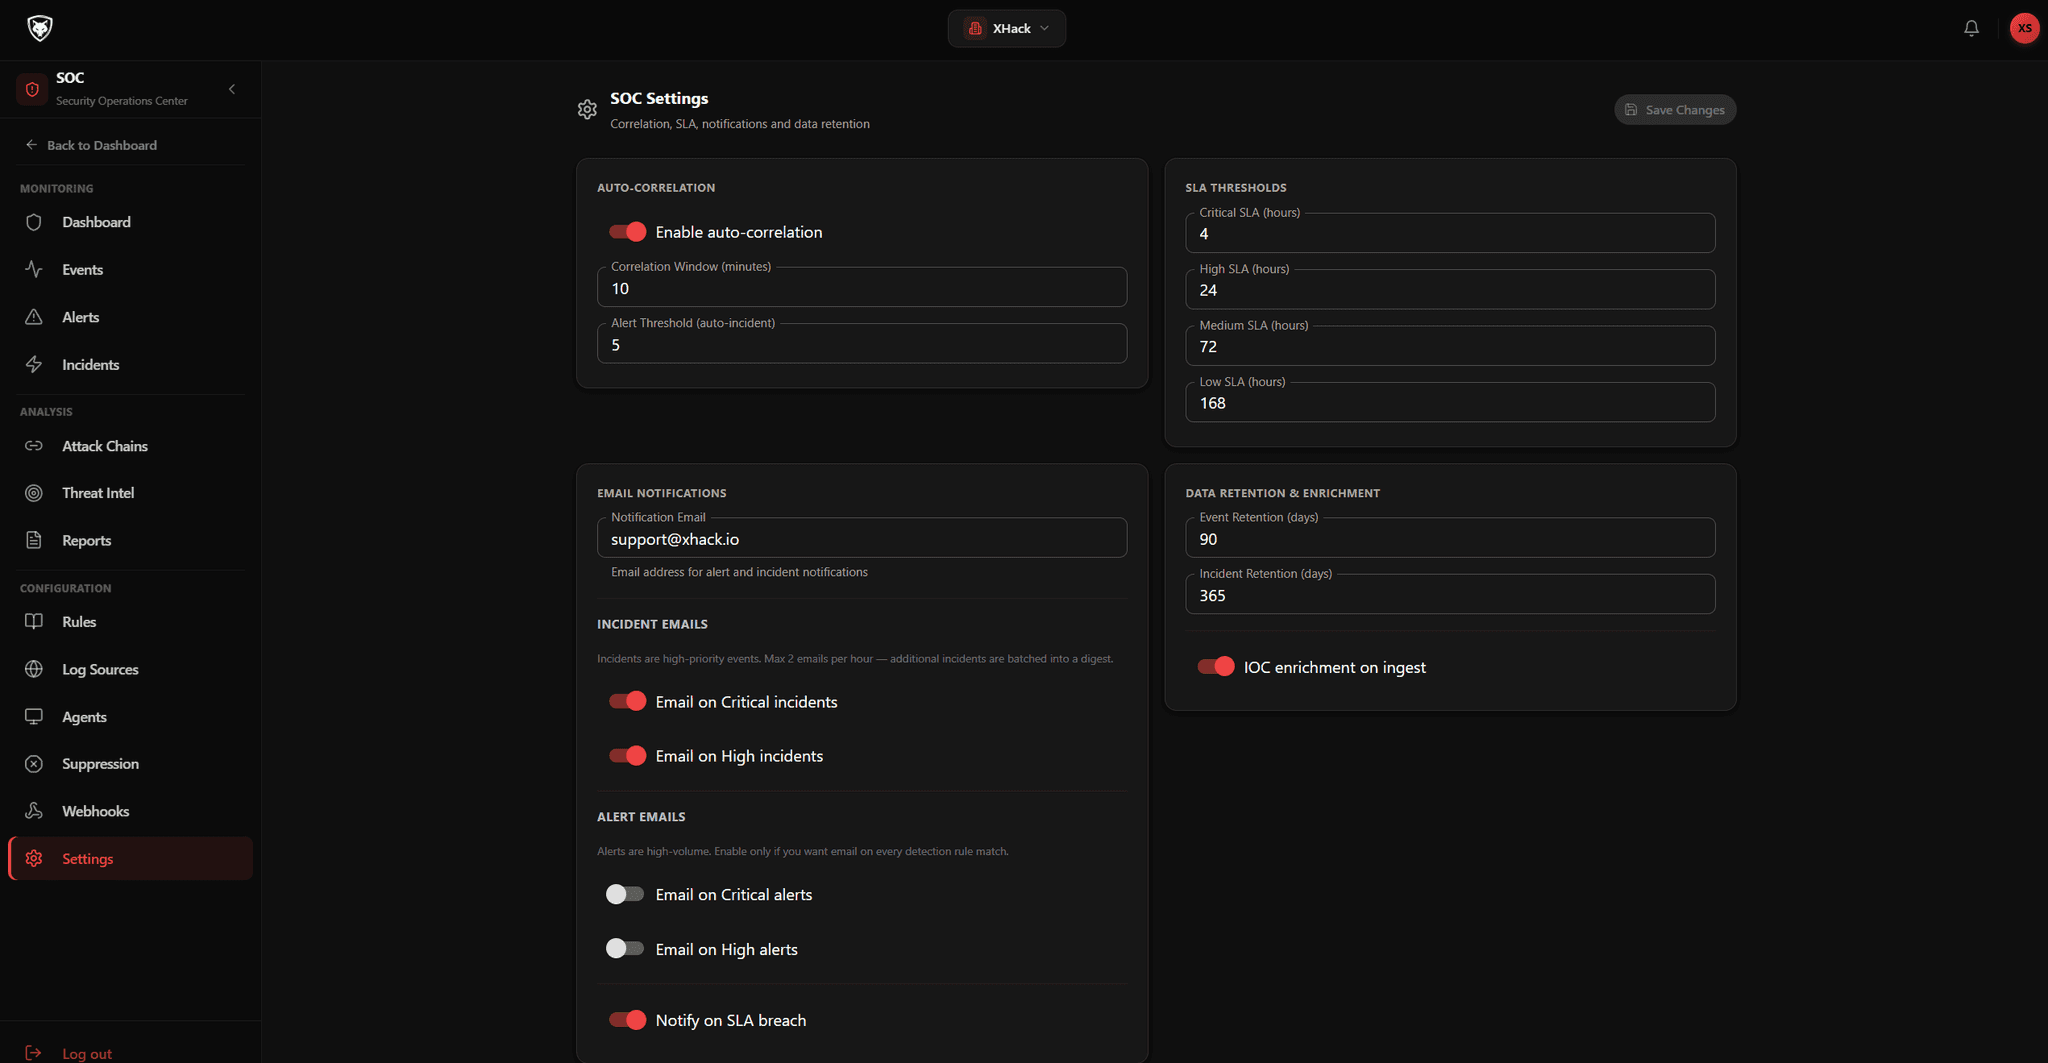
Settings & roles
Role-based access shared with the rest of your XHack platform account.
Questions
The SOC Dashboard, answered
No. The SOC Dashboard is built to sit alongside what you already run. Cloudflare, Wazuh, your own log pipelines and any HTTP-capable automation tool can all feed it at the same time, and it normalises everything into one event stream for analysis.
In real time. Every ingestion method delivers data as it happens, so the dashboard always reflects the current state of your environment rather than a batch from an hour ago.
That is exactly what the platform is designed to prevent. Alert stacking collapses repeat hits from the same source into a single alert with a count. Framework-aware suppression keeps rules from firing on ordinary page loads and static assets. Email digests are rate-limited to two per hour per tenant, and you choose which severities reach which people.
Yes. The rules engine gives you eighteen operators, nested AND/OR groups and threshold rules that fire only after a condition repeats within a time window. If you would rather describe what you want in plain English, the AI generator writes the complete rule for you to review before it goes live.
You promote it to an incident, manually or automatically from a rule. Each incident carries a severity, an assignee, a status that moves from new through investigating, contained and resolved to closed, and a timeline of every alert and event attached to it. SLA targets per severity are tracked automatically, and breaches raise in-app and email alerts.
Events are processed inside your own tenant and are never visible to any other organisation. You set retention periods, and when you delete events, alerts or incidents they are hard deleted. Deletion frees your plan quota immediately, and every deletion is written to the audit trail.
It is part of the XHack company platform and runs inside the same multi-tenant architecture as everything else. Your team reaches it through the same account with the same role-based permissions, so security operations are a natural part of how you already use XHack.
Stand up your SOC today
Connect a source, watch events land in real time, and let the engine surface what actually matters. Start in the dashboard or book a walkthrough with our team.