
SOC Dashboard — AI-Driven Threat Detection and Response
Centralise your security logs and events in one AI-powered dashboard. Detect threats in real time with custom detection rules, attack chain correlation, alert stacking, incident management with SLA tracking, and integrations with Cloudflare, Wazuh, and more.
Your Security Operations, All in One Place
The XHack SOC Dashboard is a security operations centre built for modern organisations. It ingests your logs and security events, runs them through an AI analysis engine and a configurable detection rules engine, surfaces real threats, correlates multi-stage attacks, and gives your team the tools to investigate and respond — without needing a room full of analysts to make sense of the noise.
It connects to the tools and infrastructure you already have. There is no need to replace your existing stack. The SOC Dashboard works alongside it.
How Logs Get In
There are multiple ways to get your data into the SOC Dashboard, and you can use all of them at the same time depending on your infrastructure.
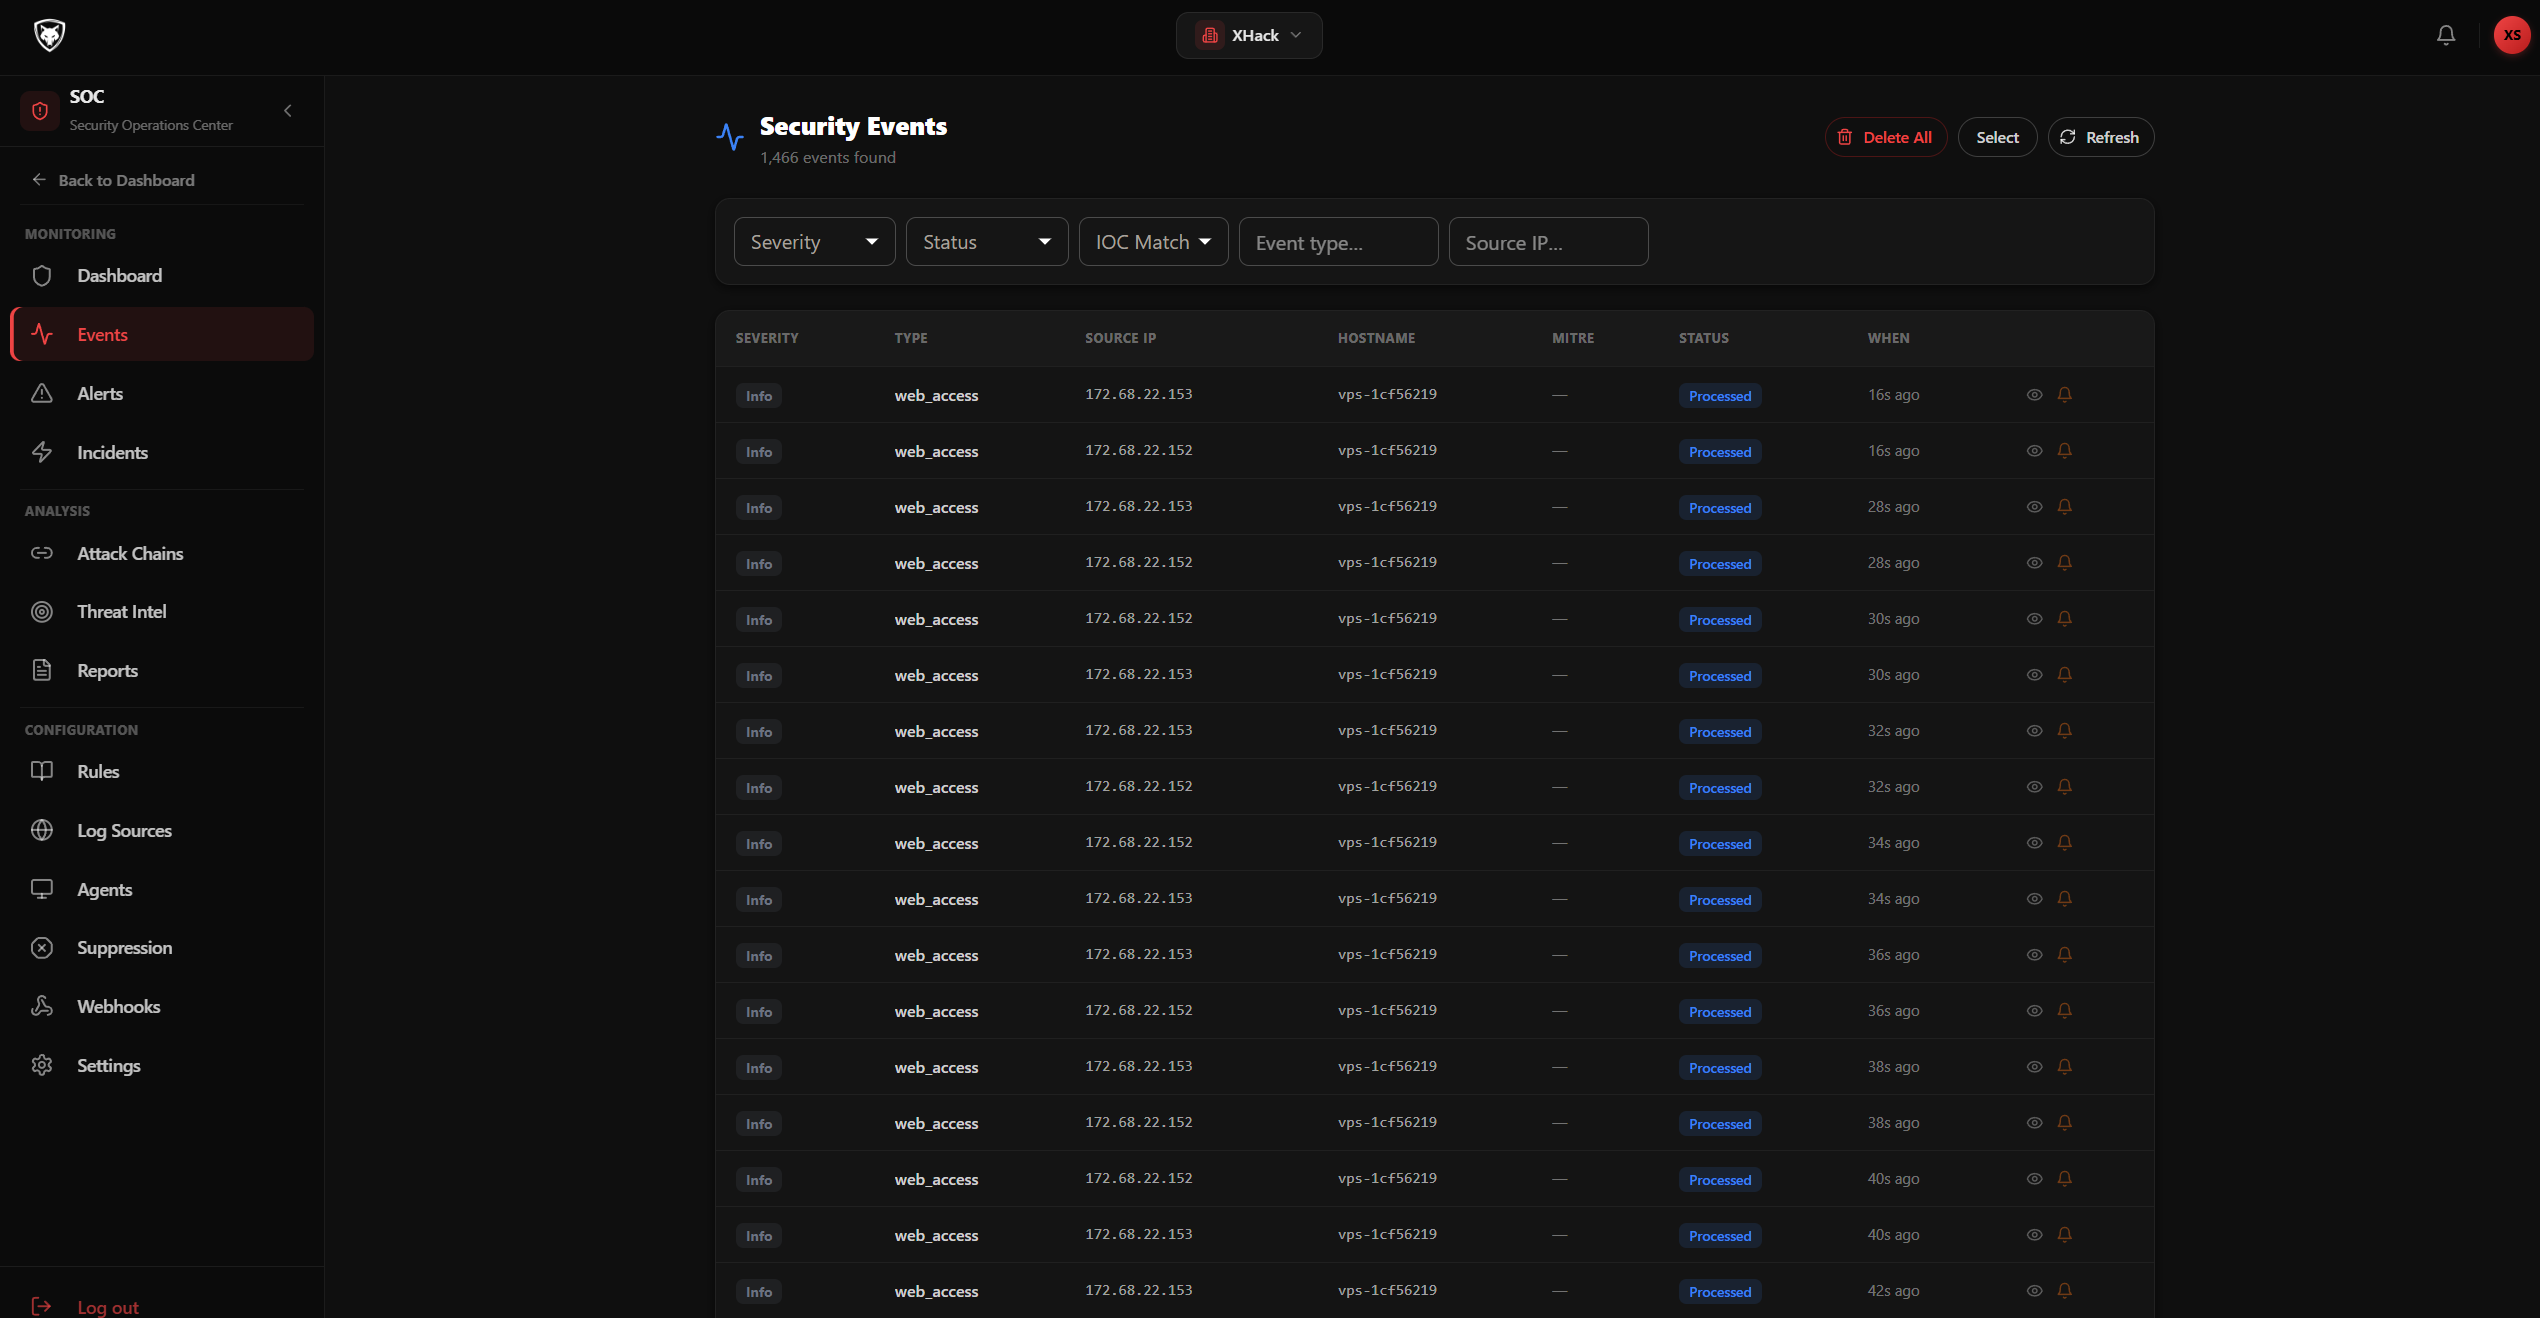
Cloudflare integration connects directly to your Cloudflare zones and pulls security events — WAF blocks, firewall rule matches, bot detections, and managed challenges. Setup requires a Cloudflare API token and zone ID. Events flow in automatically and are normalised into the XHack event format for analysis.
Wazuh integration connects to your Wazuh manager and ingests alerts, file integrity monitoring events, vulnerability detections, and agent-reported security data. If your organisation already runs Wazuh, you can have its data flowing into XHack SOC within minutes.
Webhook forwarding lets you build custom pipelines using automation platforms like n8n, Tines, or any HTTP-capable tool. Send events to the XHack log API endpoint in a supported format and they are ingested immediately.
The XHack log wrapper is a lightweight component that can be deployed in your environment to forward access logs, application events, authentication events, and other security-relevant data from your systems directly to your SOC account.
All methods deliver data securely and in real time, so the dashboard always reflects the current state of your environment.
Detection Rules Engine
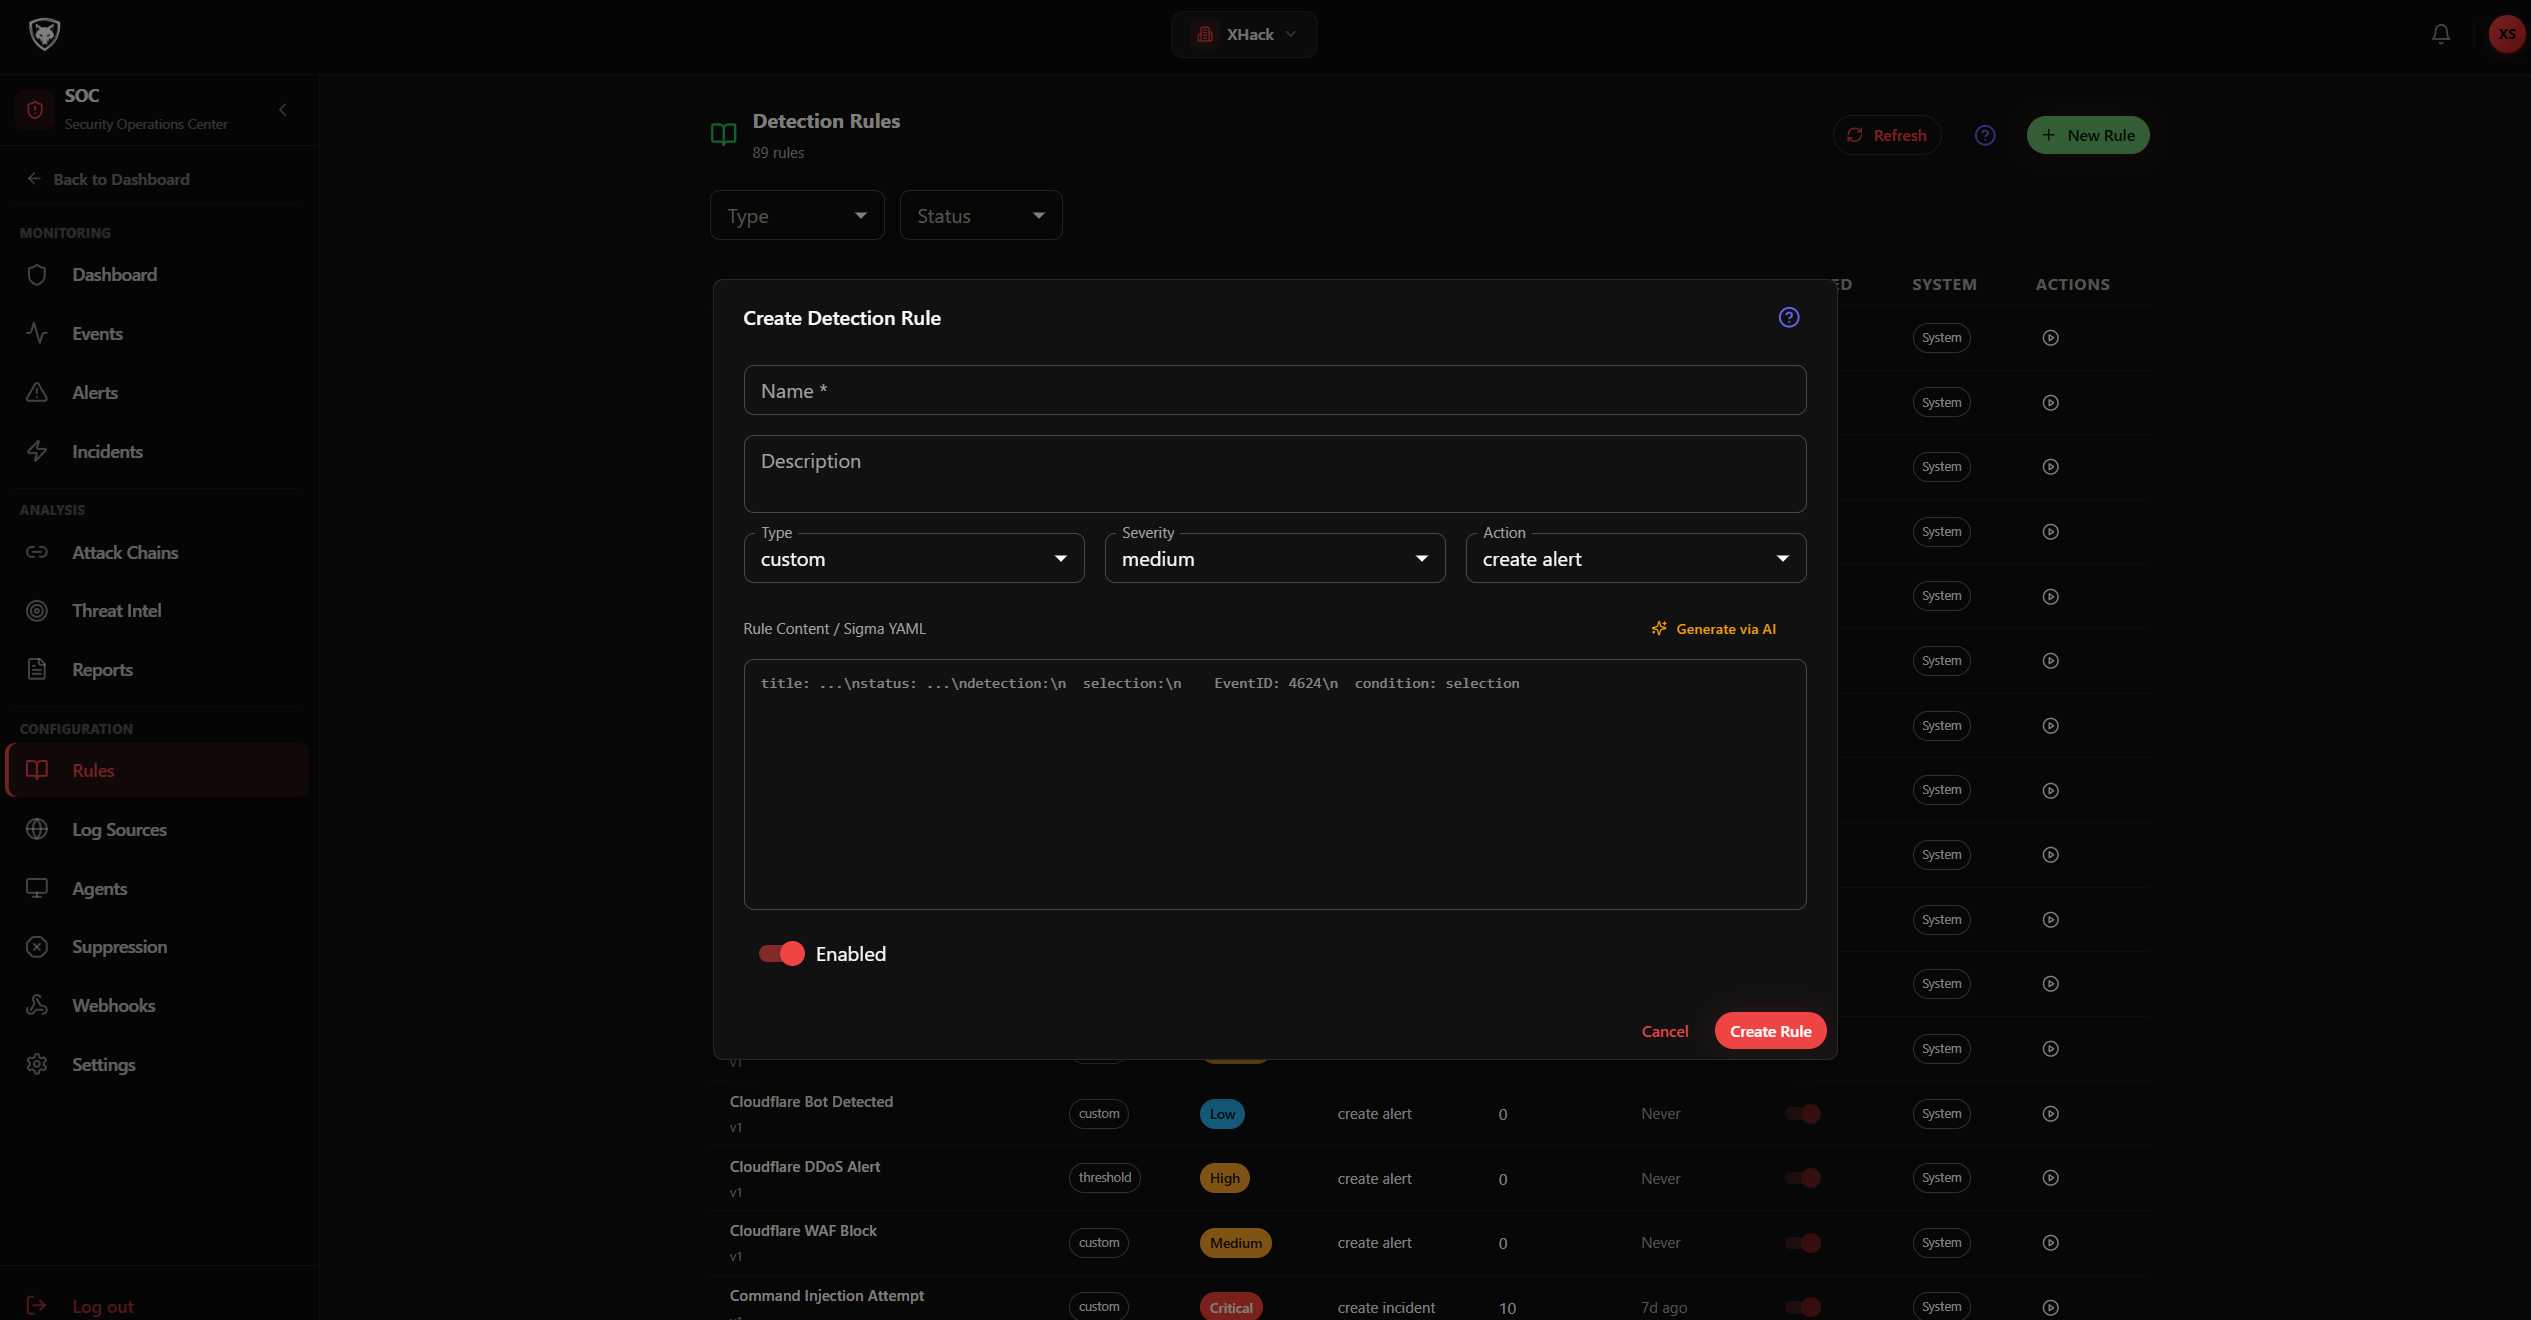
Not every organisation has the same threat model, and the SOC Dashboard reflects that with a powerful detection rules engine that gives your team full control over what triggers alerts.
Rules support 18 different operators including exact match, contains, starts with, regex, numeric comparisons, exists checks, and their negated forms. Conditions can be nested into groups with AND/OR logic, letting you build complex detection logic that matches real-world attack patterns.
Threshold rules trigger only when a condition is met N times within a time window. For example, you can create a rule that alerts only when 20 or more requests from the same IP match a web scanner signature within five minutes — eliminating one-off false positives from automated crawlers.
Framework-aware suppression prevents false positives from modern web frameworks. Rules can exclude paths like /_next/, /_nuxt/, and /static/, and ignore static asset extensions like .js, .css, .png, and .woff2. This means your SQL injection rule fires on actual attacks, not on legitimate Next.js page navigations.
AI-assisted rule generation lets you describe what you want to detect in plain English, and the AI generates a complete rule with conditions, severity, and action — ready for review and activation.
The platform ships with pre-built rules covering SQL injection, XSS, command injection, path traversal, SSRF, SSTI, HTTP response splitting, open redirect, sensitive file probing, web scanner detection, admin panel brute force, Log4Shell, and rapid error scanning.
Alert Stacking — Cut Through the Noise
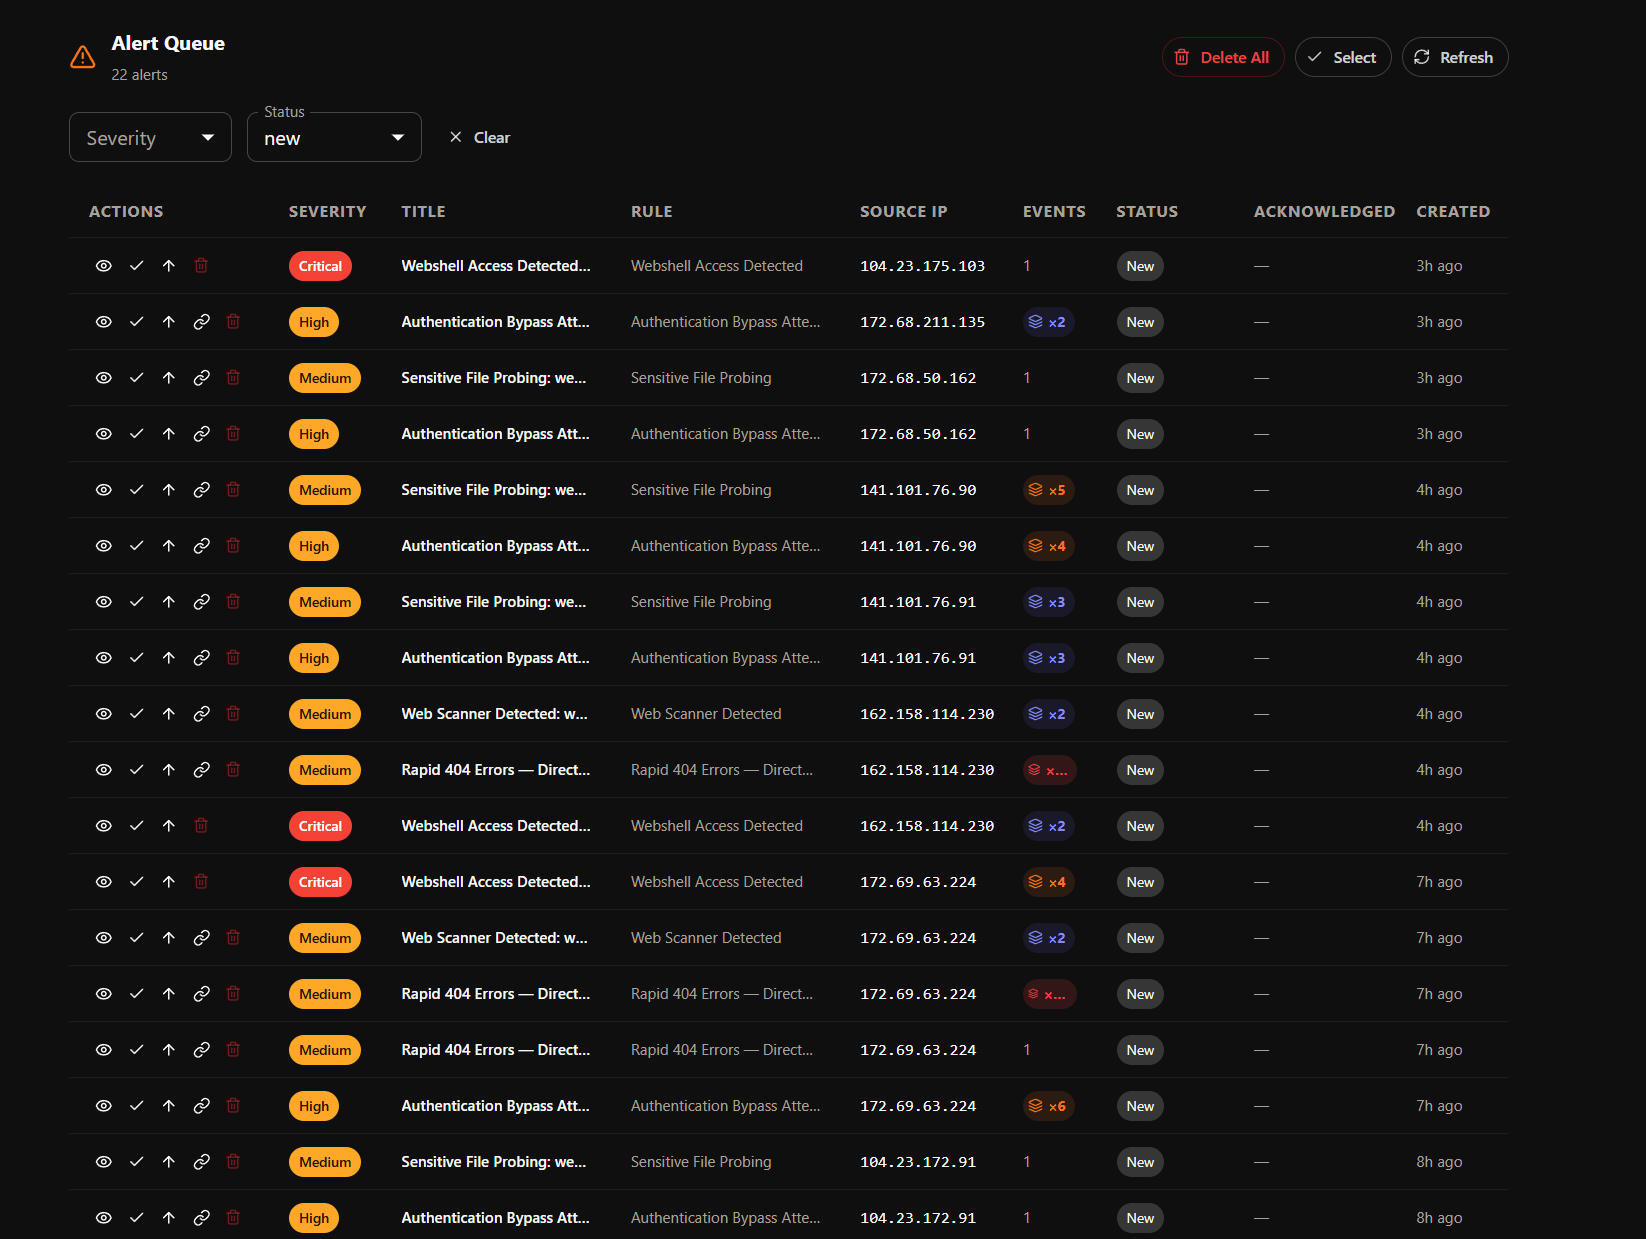
When the same attack pattern hits repeatedly from the same source, traditional SOC tools generate hundreds of identical alerts. XHack SOC stacks them.
If the same detection rule fires for the same source IP within a six-hour window, subsequent events are stacked into the existing alert rather than creating new ones. The alert shows a count badge indicating how many events it contains, and you can expand any stacked alert to see every individual event with its own normalised data, timestamps, and raw payload.
If a higher-severity event joins an existing stack, the alert severity automatically escalates. When you link a stacked alert to an incident, all events in the stack are added to the incident — no evidence is lost.
You can also remove individual events from a stack if they turn out to be unrelated, keeping your investigation clean.
Attack Chain Detection
Individual alerts tell you what happened. Attack chains tell you what is happening — and where it is headed.
The XHack SOC engine continuously correlates alerts and events across your environment, looking for multi-stage attack patterns. It maps events to kill chain stages based on the MITRE ATT&CK framework — from reconnaissance and initial access through execution, persistence, privilege escalation, lateral movement, and exfiltration.
When two or more stages are detected from related indicators within a configurable time window, the engine creates an attack chain with a severity that reflects both the stages involved and the individual event severities. An attack chain that includes execution and exfiltration stages is classified differently from one that shows only reconnaissance and initial access.
This gives your team a higher-level view of sophisticated attacks that span multiple events, multiple systems, and multiple hours.
MITRE ATT&CK Integration
The SOC Dashboard maintains a synchronised copy of the MITRE ATT&CK framework. Events and alerts are automatically mapped to tactics and techniques where possible, giving your team standardised language for discussing threats and a direct reference to MITRE documentation for every classified event.
This integration also powers the attack chain detection, which uses ATT&CK tactic mappings to determine which kill chain stage an event belongs to.
Incident Management
When alerts and events escalate into confirmed security incidents, the SOC Dashboard provides a structured workflow to manage them from detection to resolution.
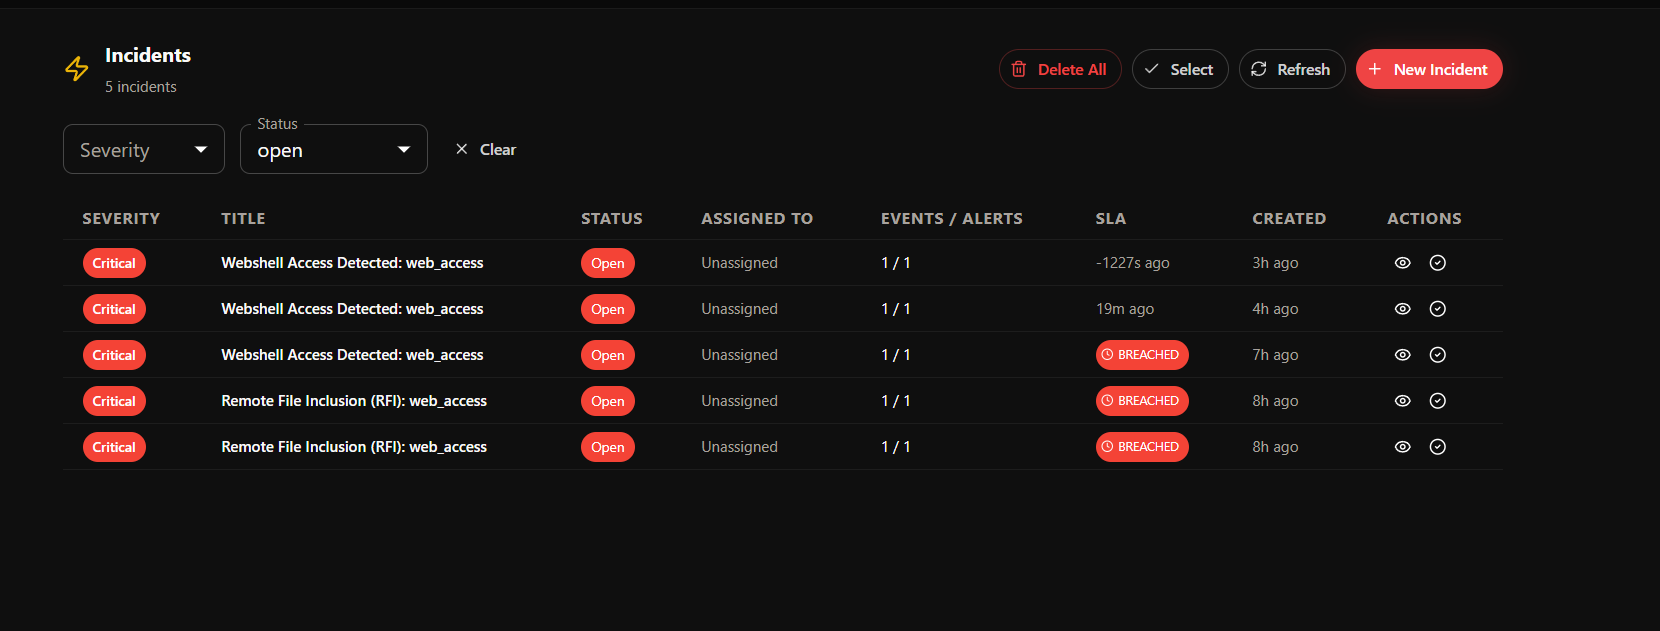
Incidents can be created manually or automatically by detection rules. Each incident has a severity level, an assigned team member, a status that moves through a defined workflow — new, investigating, contained, resolved, closed — and a complete timeline of all associated events, alerts, and actions taken.
SLA tracking enforces response time expectations. You configure target response hours for each severity level — for example, four hours for critical, twenty-four hours for high, seventy-two hours for medium, and one hundred and sixty-eight hours for low. The system monitors open incidents against these targets and flags SLA breaches with in-app notifications and email alerts.
Incidents can be linked to alerts and events at any time. All evidence stays connected, so an investigator opening an incident sees the complete picture — every alert that contributed, every event in those alerts, and the full timeline of what was detected and when.
Notifications That Keep You Informed
The SOC Dashboard sends configurable email notifications and in-app alerts so your team stays informed without being overwhelmed.
Email notifications are rate-limited to prevent alert fatigue — a maximum of two digest emails per hour per tenant, delivered only for the severity levels you choose. You can enable notifications for critical and high severity incidents independently from alert notifications, giving different team members different noise levels.
In-app notifications appear instantly for new incidents, SLA breaches, and other events you configure, with direct links to the relevant dashboard page.
Your Data, Under Your Control
Events are processed in your isolated tenant environment and are not visible to any other organisation on the platform. You control what stays and for how long through configurable retention periods.
When you delete events, alerts, or incidents, they are hard deleted. Deletion frees up your plan quota immediately — if your plan includes 100,000 events per month and you delete 1,000, those 1,000 slots are available for new events.
The dashboard provides a clean data management interface where you can review what is retained, filter by date range or severity, and delete individual items or in bulk. Every deletion is logged in the audit trail.
Built Into the Platform
The SOC Dashboard is part of the XHack company platform and operates within the same multi-tenant architecture that governs all platform features. Your team members access it through the same platform account with the same role-based permissions, so security operations are a natural part of how your organisation uses XHack — not a separate product running alongside it.
Try it on your own stack
Run this against a target you own and judge it on what it finds, not on a description.
Get StartedQuestions about this?
You get a researcher on the call, not a sales engineer reading the same page back to you.
Contact supportMore in Security platform
Capabilities that sit alongside this one.